Status
Categories:
The status view is always called in respect to one specified cluster. It displays the current state of utilization of the respective clusters resources, as well as user and project top lists and distribution histograms of the allocated resources per job.
2 Minutes.Utilization Information
For each subluster, utilization is displayed in two parts rendered in one row.
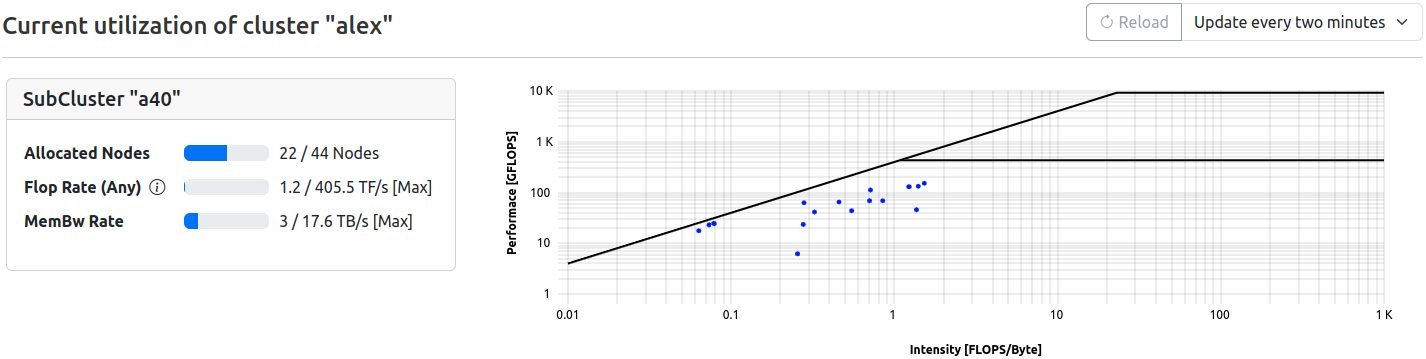
Gauges
Simple gauge representation of the current utilization of available resources
| Field | Description | Note |
|---|---|---|
| Allocated Nodes | Number of nodes currently allocated in respect to maximum available | - |
| Flop Rate (Any) | Currently achieved flop rate in respect to theoretical maximum | Floprate calculated as f_any = (f_double x 2) + f_single |
| MemBW Rate | Currently achieved memory bandwidth in respect to technical maximum | - |
Roofline
A roofline plot representing the utilization of available resources as the relation between computation and memory for each currently allocated, running job at the time of the latest data retrieval. Therefore, no time information is represented (all dots in blue, representing one job each).
Top Users and Projects
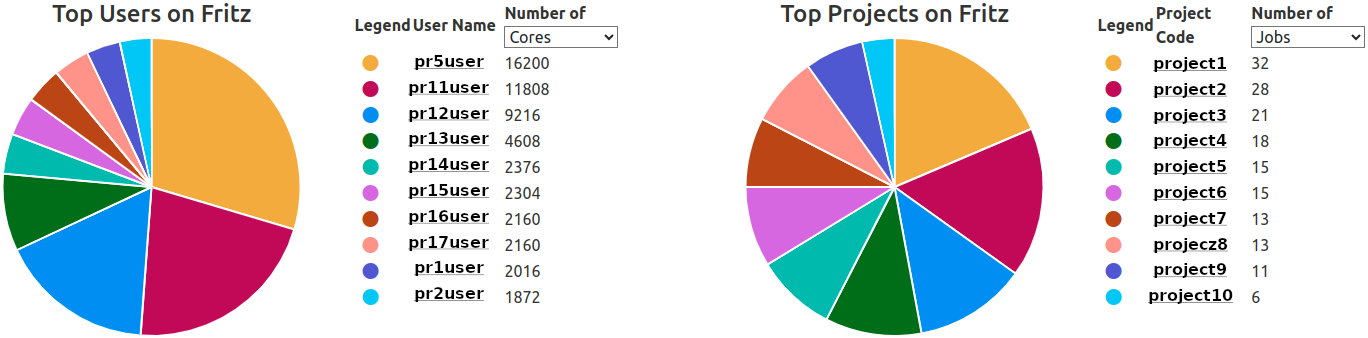
The ten most active users or projects are rendered in a combination of pie chart and tabular legend. By default, the top ten users or projects with the most allocated, running jobs are listed.
The selection can be changed directly in the tables header at Number of ..., and can be changed to
- Jobs (Default)
- Nodes
- Cores
- Accelerators
The selection is saved for each user and cluster, and will select the last chosen type of list as default the next time this view is rendered.
Hovering over one of the pie chart fractions will display a legend featuring the identifier and value of the selected parameter.
“User Names” and “Project Codes” are rendered as links, leading to user job lists or project job lists with preset filters for cluster, entity ID, and state == running.
Statistic Histograms
Several histograms depicting the utilization of the clusters resources, based on all currently running jobs are rendered here:
- Duration Distribution
- Number of Nodes Distribution
- Number of Cores Distribution
- Number of Accelerators Distribution
Additional Histograms showing specified footprint metrics across all systems can be selected via the “Select histograms” menu next to the refresher tool.
footprint flag is set in the respective metrics’ configuration will be shown.Metric Status Tab
The status details panel contains a second tab labeled Metric Status that provides an overview of node health conditions across the cluster.
Node State Distribution
Two pie charts display the current distribution of:
- Scheduler States: The allocation state of nodes as reported by the scheduler (e.g.,
allocated,idle,down). - Health States: The metric monitoring health state of nodes (e.g.,
ok,warn,critical,unknown).
Each chart is paired with a summary table listing each state and the number of nodes in that state.
Node Health Table
A filterable table lists individual nodes with the following columns:
- Hostname: Node identifier, linked to the node detail view.
- Scheduler State: The current scheduler allocation state.
- Health State: The current metric monitoring health state.
- Faulty Metrics: List of metrics that are missing or reporting unhealthy values.
The table can be filtered by hostname, scheduler state, or health state using the filter inputs above each column.
Feedback
Was this page helpful?
Glad to hear it! Please tell us how we can improve.
Sorry to hear that. Please tell us how we can improve.