Nodes
Categories:
Node Overview
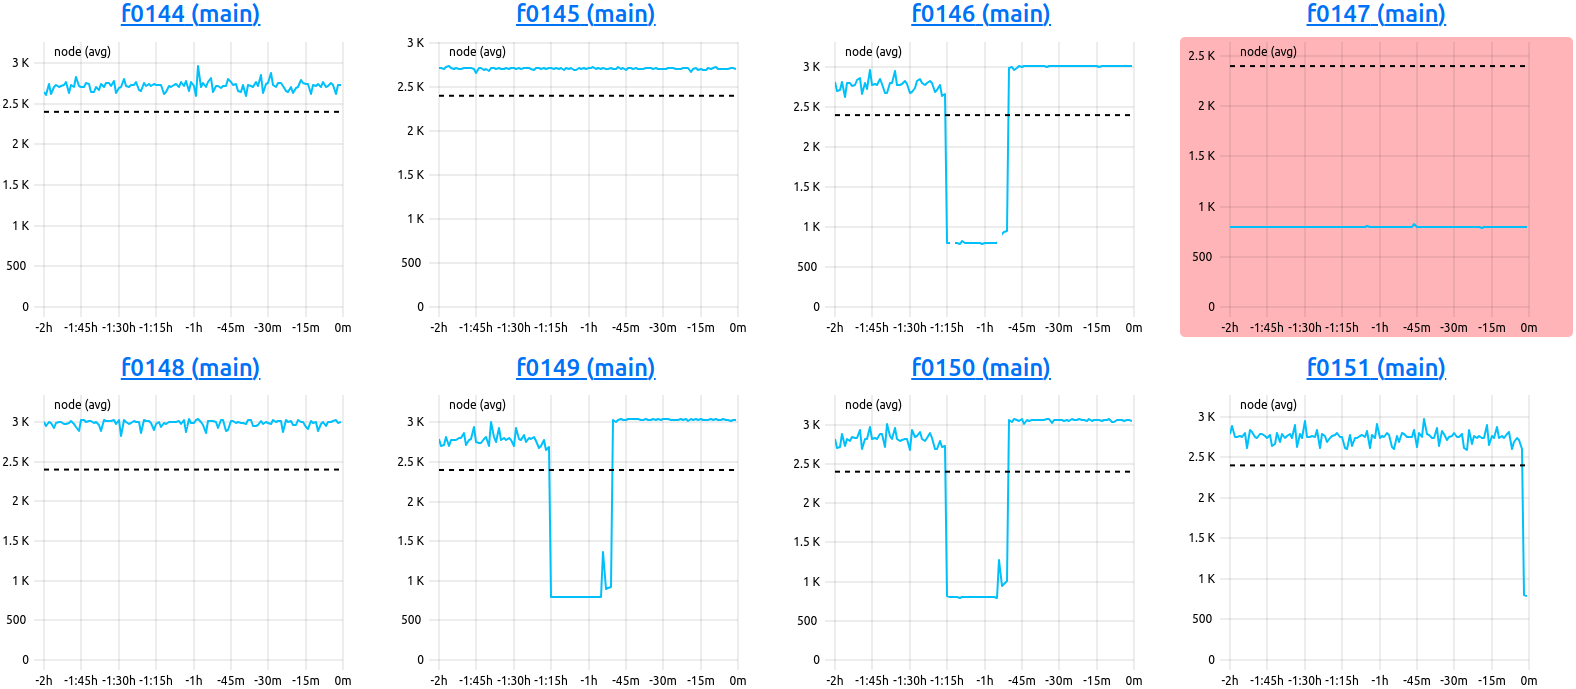
Nodes View. This example shows the last two hours of the ‘clock’ metric of eight nodes. Node ‘f0147’ of the ‘main’ partition has an average below the configured ‘alert’ threshold, and is colored in red.
The node overview is always called in respect to one specified cluster. It displays the current state of all nodes in that cluster in respect to one selected metric, rendered in form of metric plots, and independent of job meta data, i.e. without consideration for job start and end timestamps.
Overview Selection Bar

Selections regarding the display, and update, of the plots rendered in the node table can be performed here:
- Find Node:: Filter the node table by hostname. Partial queries are possible.
- State:: Filter the node table by last reported node state.
- Displayed Timerange: Select the timeframe to be rendered in the node table
Custom: Select timestampfromandtoin which the data should be fetched. It is possible to select date and time.15 Minutes, 30 Minutes, 1 Hour, 2 Hours, 4 Hours, 12 Hours, 24 Hours
- Metric:: Select the metric to be fetched for all nodes. If no data can be fetched, messages are displayed per node.
- (Periodic) Reload: Force reload of fresh data from the backend or set a periodic reload in specified intervals
30 Seconds, 60 Seconds, 120 Seconds, 5 Minutes
Node Table
Nodes (hosts) are ordered alphanumerically in this table, rendering the selected metric in the selected timeframe.
Each heading links to the singular node view of the respective host.
A colored pill indicates the currently reported node state for that node.
Node List
Nodes View.
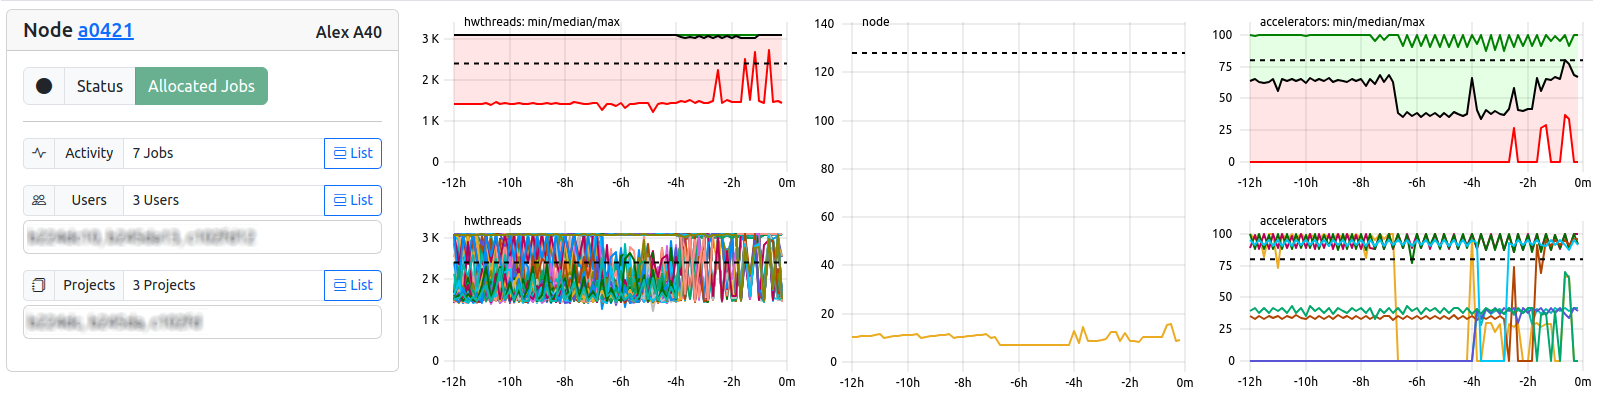
The node list view is also always called in respect to one specified cluster, and optionally, subCluster. It displays the current state of all nodes in that cluster (or subCluster) in respect to a selectable number, and order, of metrics. Plots are rendered in form of metric plots, and are independent of job meta data, i.e. without consideration for job start and end timestamps.
The always visible “Node Info”-Card displays the following information. “List”-Bottons will lead to according views with preset filters.
| Field | Example | Description | Destination |
|---|---|---|---|
| Card Header | Node a0421 Alex A40 | Hostname and Cluster | Node View |
| Job Indicator | Exclusive | Indicates the joba nd metric states via keywords, see below | - |
| State Indicator | Allocated | Indicates the host state via keywords, see below | - |
| Activity | 2 Jobs | Number of Jobs currently running on host | Job List |
| Users | 2 Users | Number and IDs of users currently running jobs | User Table |
| Projects | 1 Project | Number and IDs of projects currently running jobs | Project Table |
In order to give an idea of the current job states, the following indicators are possible for the job indicator:
| Job Indicator | Type | Description |
|---|---|---|
| Fetching | Info | Data for selected metrics is currently fetched from the backend metric store. |
| Missing Metrics | Warning | At least one of the selected metrics does not return data successfully. Can hint to configuration problems. |
| No Metrics | Error | None of the selected metrics return data successfully. Node could be offline or misconfigured. |
| Exclusive | Job-Info | One exclusive job is currently running, utilizing all of the nodes’ hardware. |
| Shared | Job-Info | One or more shared jobs are currently running, utilizing allocated amounts of the nodes’ hardware. |
| Running | Job-Info | If more jobs than one are running, but all jobs are marked as ’exclusive’, this fallback is used. |
| None | Job-Info | No currently active jobs. |
The node hardware states are shown as reported by the scheduler and adapter interface. The following indicators are possible for the node state indicator:
| Node Indicator | Color | Description |
|---|---|---|
| Allocated | The node has been allocated to one or more jobs. | |
| Reserved | The node is in an advanced reservation and not generally available. | |
| Idle | The node is not allocated to any jobs and is available for use. | |
| Mixed | The node has some of its CPUs allocated while others are idle. | |
| Down | The node is unavailable for use. Nodes report this state if some failure occurs. | |
| Unknown | The scheduler has just started and the node’s state has not yet been determined. | |
| Not in DB | The node not known in database, but returned metric data. |
List Selection Bar

Nodes List Header Options.
The selection header allows for configuration of the displayed data in terms of selected metrics or timerange.
| Field | Example | Description | |
|---|---|---|---|
| Metrics | 4 Selected | Menu for and Number of Metrics currently selected. | |
| Resolution | 600 | Resolution of the metric plots rendered for each node. | |
| Find Node(s) | a0421 | Filter for hostnames | |
| State | idle | Filter the node table by last reported node state. | |
| Range | Last 12hrs | Time range to be displayed as X-Axis. | |
| Refresh | 60 Seconds | Enable automatic refresh of metric plots. |
Extended Legend
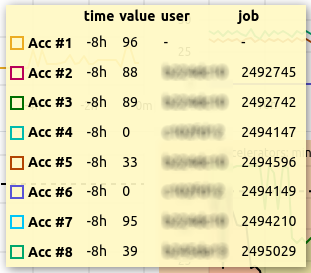
Nodes List Extended Legend. Usernames and Job-IDs are shown in addition to the Resource-ID for shared resources.
For nodes with multiple jobs running on them, accelerator metrics are extended by the username and the job-id currently utilizing this hardware ID. This is based on the ID information sent during job-start to cc-backend (Database resources-column).
Feedback
Was this page helpful?
Glad to hear it! Please tell us how we can improve.
Sorry to hear that. Please tell us how we can improve.