Node
Categories:
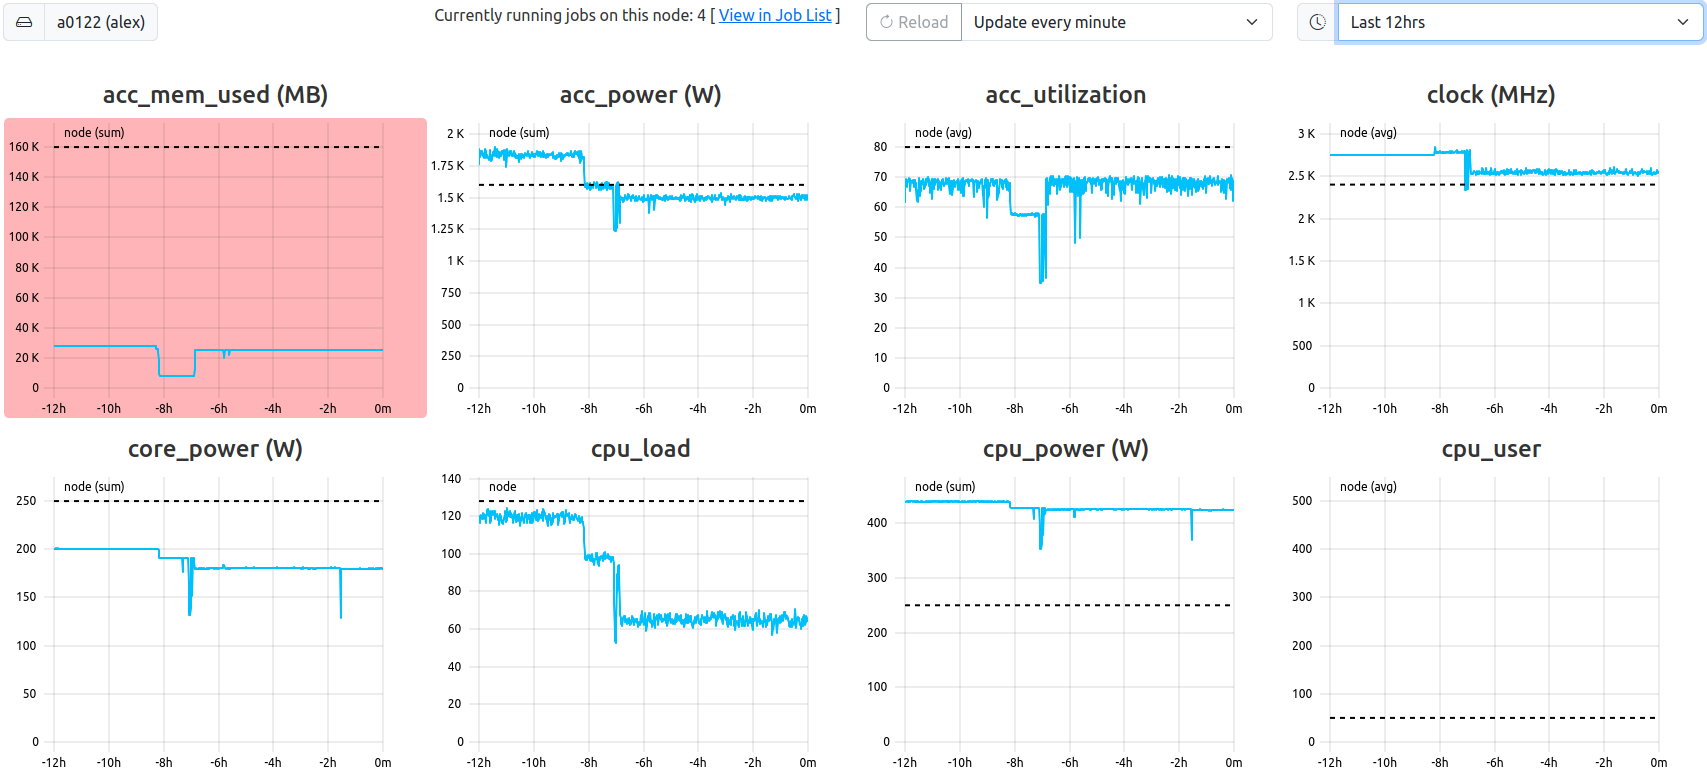
Node View. This example shows the last twelve hours of all metrics of the specified node ‘a0122’. The metric ‘acc_mem_used’ has an average below the configured ‘alert’ threshold, and is colored in red.
The node view is always called in respect to one specified cluster and one specified node (host). It displays the current state of all metrics for that node, rendered in form of metric plots, and independent of job meta data, i.e. without consideration for job start and end timestamps.
Selection Bar
Information and selections regarding the data of the plots rendered in the node table can be performed here:
- Name: The hostname of the selected node
- Node State: Currently reported node state
- Activity: Number of jobs currently allocated to this node. Exclusively used nodes will always display
1if a job is running at the moment, or0if not.- The “Show List”-Bitton leads to the joblist with preset filter fetching only currently allocated jobs on this node.
- Displayed Timerange: Select the timeframe to be rendered in the node table
Custom: Select timestampfromandtoin which the data should be fetched. It is possible to select date and time.15 Minutes, 30 Minutes, 1 Hour, 2 Hours, 4 Hours, 12 Hours, 24 Hours
- (Periodic) Reload: Force reload of fresh data from the backend or set a periodic reload in specified intervals
30 Seconds, 60 Seconds, 120 Seconds, 5 Minutes
The node hardware states are shown as reported by the scheduler and adapter interface. The following indicators are possible for the node state indicator:
| Node Indicator | Color | Description |
|---|---|---|
| Allocated | The node has been allocated to one or more jobs. | |
| Reserved | The node is in an advanced reservation and not generally available. | |
| Idle | The node is not allocated to any jobs and is available for use. | |
| Mixed | The node has some of its CPUs allocated while others are idle. | |
| Down | The node is unavailable for use. Nodes report this state if some failure occurs. | |
| Unknown | The scheduler has just started and the node’s state has not yet been determined. | |
| Not in DB | The node not known in database, but returned metric data. |
Node Table
Metrics are ordered alphanumerically in this table, rendering each metric in the selected timeframe.
Feedback
Was this page helpful?
Glad to hear it! Please tell us how we can improve.
Sorry to hear that. Please tell us how we can improve.