Job List
Categories:
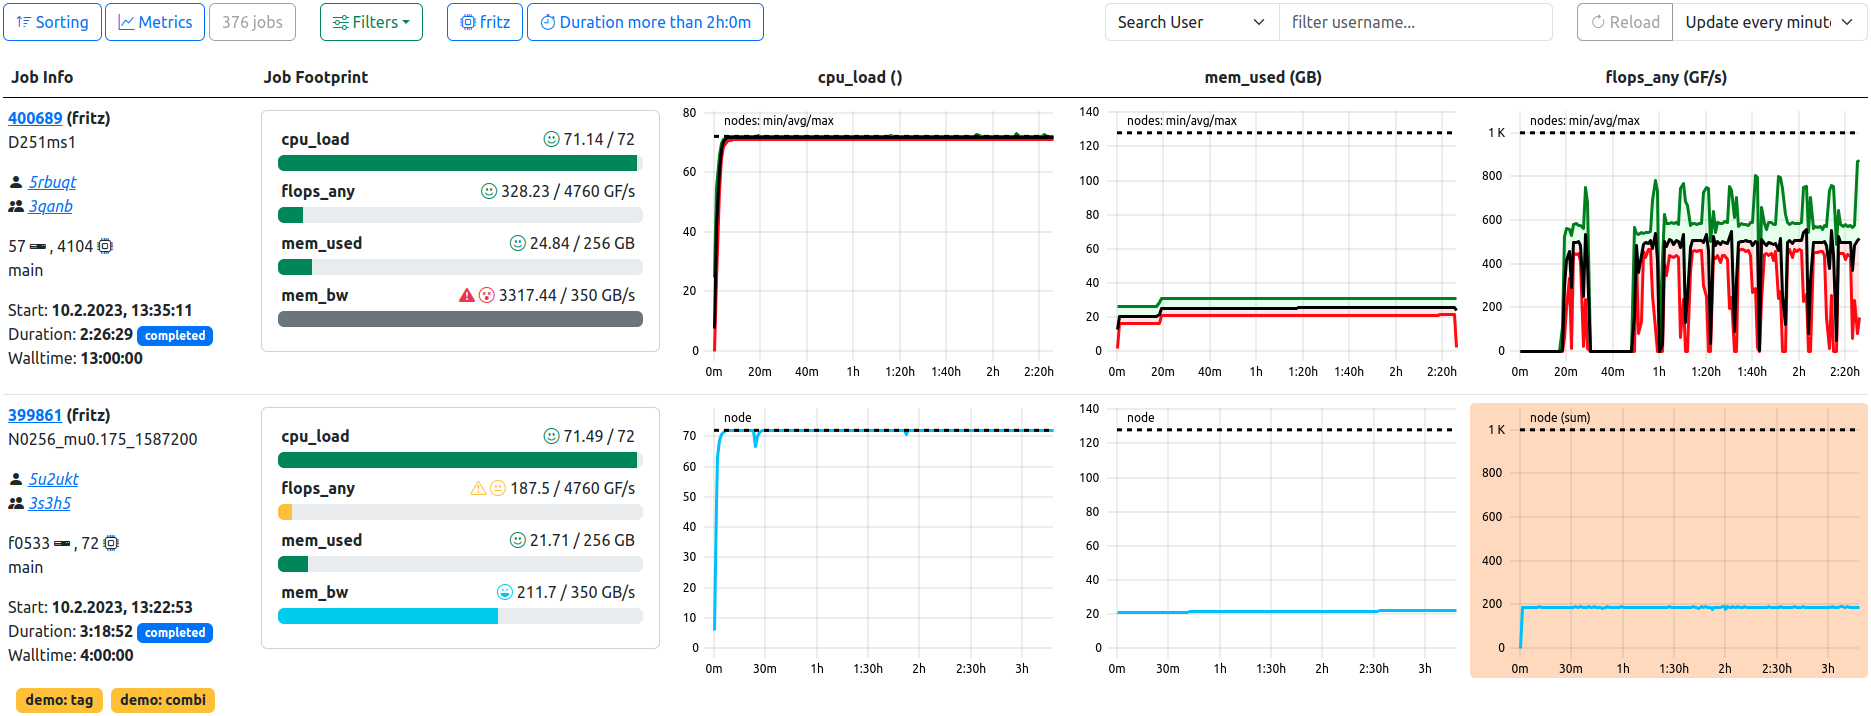
Job List. In this example, the optional footprint is displayed, two filters are active, and the table is refreshed every minute. The first job has a high node count, therefore the plots are rendered in the statistics variant. The ‘mem_bw’ metric likely has artifacts as shown by the grey footprint. The second job has tags and displays less than optimal performance in the ‘flops_any’ metric, coloring the respective plot background in orange.
The primary view of ClusterCockpits webinterface is the tabular listing of jobs, which displays various information about the jobs returned by the selected filters. This information includes the jobs’ full meta data, such as runtime or job state, as well as an optional footprint, allowing quick assessment of the jobs performance.
Most importantly, the list displays a selectable array of metrics as time dependent metric plots, which allows detailed insight into the jobs performance at a glance.
manager role, this view is labelled as ‘Managed Jobs’. Displayed jobs are limited to jobs started by users of the managed projects (usergroups), otherwise the functionality is identical, e.g. filtering or footprint display.Job List Toolbar

Several options allow configuration of the displayed data, which are also persisted for each user individually, either for general usage or by cluster.
Sorting
Basic selection of sorting parameter and direction. By default, jobs are sorted by starting timestamp in descending order (latest jobs first). Other selections to sort by are
- Duration
- Number of Nodes
- Number of Hardware-Threads
- Number of Accelerators
- Total Energy Consumed
- Additional configured Metric Statistics
- …
footprint flag is set in the respective metrics’ configuration will be available as additional sorting options.Switching of the sort direction is achieved by clicking on the arrow icon next to the desired sorting parameter.
Metrics
Selection of metrics shown in the tabular view for each job. The list is compiled from all available configured metrics of the ClusterCockpit instance, and the tabular view will be updated upon applying the changes.
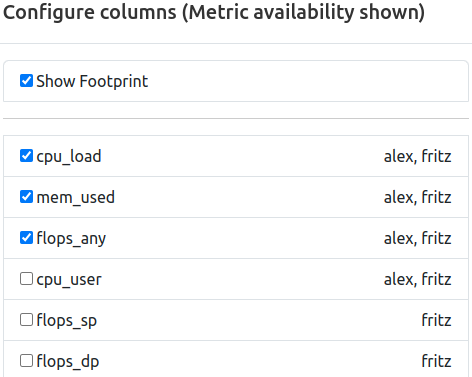
In addition to the metric names themselves, the availability by cluster is indicated as comma seperated list next to the metric identifier. This information will change to the availablility by partition if the cluster filer is active.
It is furthermore possible to edit the order of the selected metrics. This can be achieved by dragging and dropping the metric selectors to the desired order, where the topmost metric will be displayed next to the “Job Info” column, and additional metrics will be added on the right side.
Lastly, the optional “Footprint” Column can be activated (and deactivated) here. It will always be rendered next to the “Job Info” column, while metrics start right of the “Footprint” column, if activated.
Filters
Selection of filters applied to the queried jobs. By default, no filters are activated if the view was opened via the navigation bar. At multiple location throughout the web-interface, direct links will lead to this view with one or more preset filters active, e.g. selecting a clusters’ “running jobs” from the home page will open this view displaying only running jobs of that cluster.
Possible options are:
- Cluster/Partition: Filter by configured cluster (and partitions thereof)
- Job State: Filter by defined job state(s)
- Start Time: Filter by start timestamp
- Duration: Filter by job duration
- Tags: Filter by tags assigned to jobs
- Resources: Filter by allocated resources or named node
- Energy: Filter by consumed total energy (for completed jobs only)
- Statistics: Filter by average usage of defined metrics
Each filter and its default value is described in detail here.
Job Count
The total number of jobs returned by the backend for the given set of filters.
Search and Reload
Search for specific jobname, project or username (privileged only) using the searchbox by selecting from the dropdown and entering the query.
Force a complete reload of the table data, or set a timed periodic reload (30, 60, 120, 300 Seconds).
Search for specific project

If the Job-List was opened via a ProjectId-Link or the Projects List, the text search will be fixed to the selected project, and allows for filtering jobnames and users in that project, as indicated by the placeholder text.
If desired, the fixed project can be removed by pressing the button right of the input field, returning the joblist to its default state.
Compare Jobs
This button is used to compare either a selected number of jobs or all jobs currently matching the selected filters by switching to the job comparison view.
Users can select the to be compared jobs in the [job info](#job-info section via the selector checkbox in the upper right corner. Alternatively, every combination of job list filters can be used to generate a comparison set.
Job List Table
The main component of the job list view renders data pulled from the database, the job archive (completed jobs) and the configured metric data source (running jobs).
Job Info
The meta data containing general information about the job is represented in the “Job Info” column, which is always the first column to be rendered. From here, users can navigate to the detailed view of one specific job as well as the user or project specific job lists.
| Field | Example | Description | Destination |
|---|---|---|---|
| Job Id | 123456 | The JobId of the job assigned by the scheduling daemon | Job View |
| Job Name | myJobName | The name of the job as supplied by the user | - |
| Username | abcd10 | The username of the submitting user | User Jobs |
| Project | abcd | The name of the usergroup the submitting user belongs to | Joblist with preset Filter |
| Resources | n100 | Indicator for the allocated resources. Single resources will be displayed by name, i.e. exclusive single-node jobs or shared resources. Multiples of resources will be indicated by icons for nodes, CPU Threads, and accelerators. | - |
| Partition | main | The cluster partition this job was startet at | - |
| Start Timestamp | 10.1.2024, 10:00:00 | The epoch timestamp the job was started at, formatted for human readability | - |
| Duration | 0:21:10 | The runtime of the job, will be updated for running jobs on reload. Additionally indicates the state of the job as colored pill | - |
| Walltime | 24:00:00 | The allocated walltime for the job as per job submission script | - |
Two additional functions are located in the upper right corner of each job information segment for each job, namely, a helper to easily copy the respective job ID to the clipboard as well as the selector checkbox to mark the respective job for job comparison (see above).
Footprint
The optional footprint column will show base metrics for job performance at a glance, and will hint to performance (and performance problems) in regard to configurable metric thresholds.
footprint flag is set in the respective metrics’ configuration will be shown in this view.Examples:
| Field | Description | Note |
|---|---|---|
| cpu_load | Average CPU utilization | - |
| flops_any | Floprate calculated as f_any = (f_double x 2) + f_single | - |
| mem_bw | Average memory bandwidth used | Non-GPU Cluster only |
| mem_used | Maximum memory used | Non-GPU Cluster only |
| acc_utilization | Average accelerator utilization | GPU Cluster Only |
Colors and icons differentiate between the different warning states based on the configured threshold of the metrics. Reported metric values below the warning threshold simply report bad performance in one or more metrics, and should therefore be inspected by the user for future performance improvement.
Metric values colored in blue, however, usually report performance above the expected levels - Which is exactly why these metrics should be inspected as well. The “maximum” thresholds are often the theoretically achievable performance by the respective hardware component, but rarely are they actually reached. Inspecting jobs reporting back such levels can lead to averaging errors, unrealistic spikes in the metric data or even bugs in the code of ClusterCockpit.
| Color | Level | Description | Note |
|---|---|---|---|
| Blue | Info | Metric value below maximum configured peak threshold | Job performance above expected parameters - Inspection recommended |
| Green | OK | Metric value below normal configured threshold | Job performance within expected parameters |
| Yellow | Caution | Metric value below configured caution threshold | Job performance might be impacted |
| Red | Warning | Metric value below configured warning threshold | Job performance impacted with high probability - Inscpection recommended |
| Dark Grey | Error | Metric value extremely above maximum configured threshold | Inspection required - Metric spikes in affected metrics can lead to errorneous average values |
Metric Row
Selected metrics are rendered here in the selected order as metric lineplots. Aspects of the rendering can be configured at the settings page.
Feedback
Was this page helpful?
Glad to hear it! Please tell us how we can improve.
Sorry to hear that. Please tell us how we can improve.