Job
Categories:
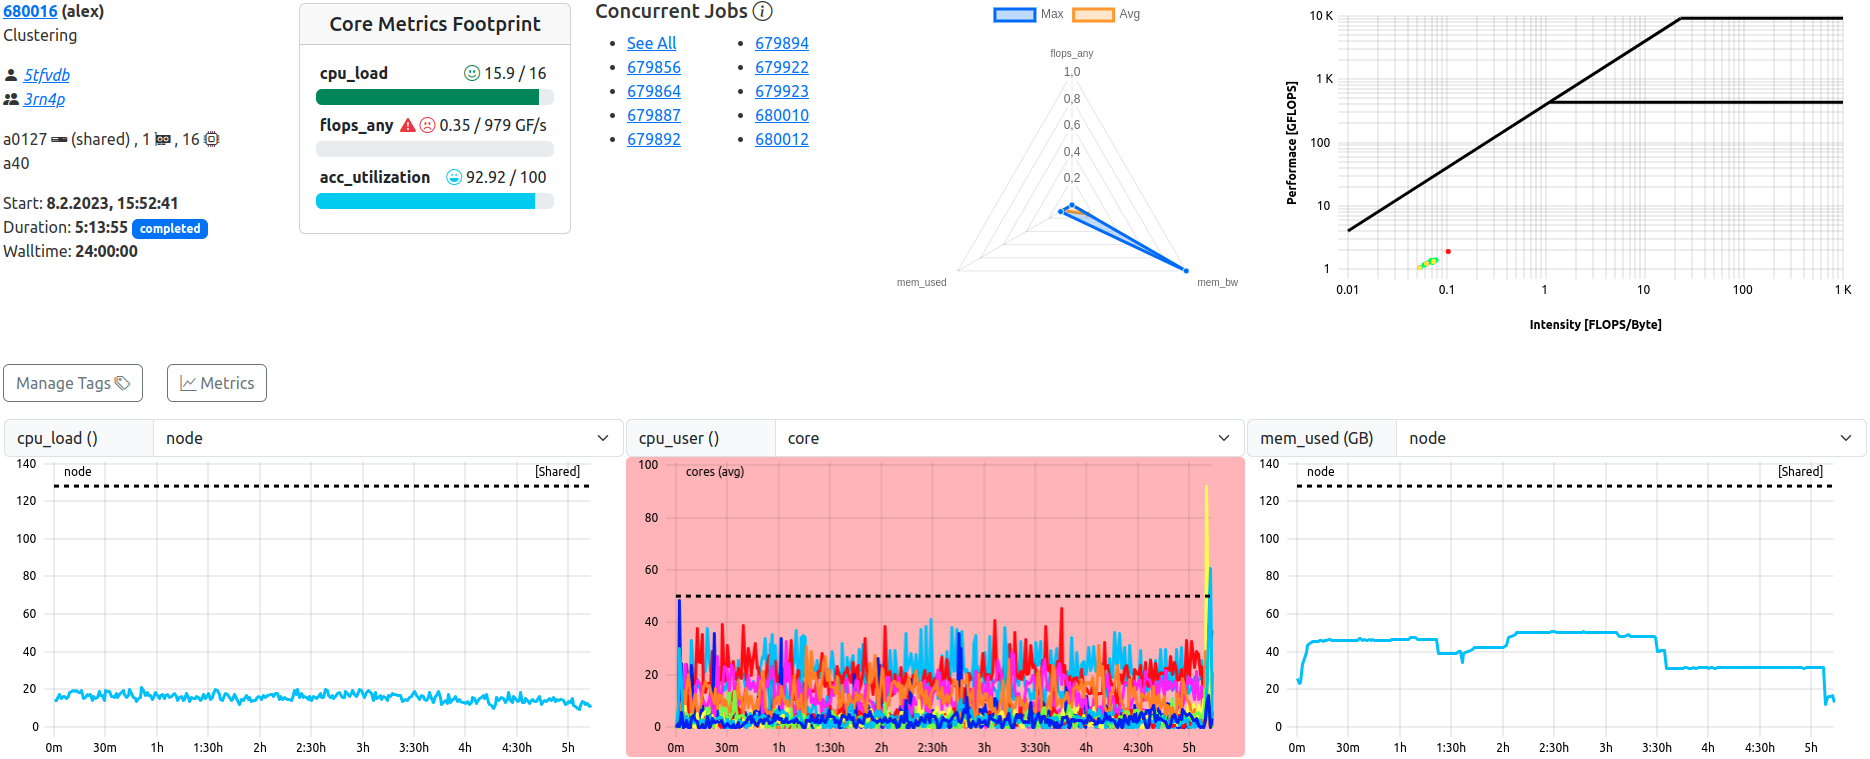
Job View. This example shows a completed, shared job with lacking ‘flops_any’ performance.
The job view displays all data related to one specific job in full detail, and allows detailed inspection of all metrics at several scopes, as well as manual tagging of the job.
Top Bar
The top bar of each job view replicates the “Job Info” and “Footprint” seen in the job list, and additionally renders general metric information in specialized plots.
For shared jobs, a list of jobs which run (or ran) concurrently is shown as well.
Job Information Tabs
Job Info
Identical to the job list equivalent, this component displays meta data containing general information about the job. From here, users can navigate to the detailed view of one specific job as well as the user or project specific job lists.
| Field | Example | Description | Destination |
|---|---|---|---|
| Job Id | 123456 | The JobId of the job assigned by the scheduling daemon. The icon on the right allows for easy copy to clipboard. | Job View |
| Job Name | myJobName | The name of the job as supplied by the user | - |
| Username | abcd10 | The username of the submitting user | User Jobs |
| Project | abcd | The name of the usergroup the submitting user belongs to | Joblist with preset Filter |
| Resources | n100 | Indicator for the allocated resources. Single resources will be displayed by name, i.e. exclusive single-node jobs or shared resources. Multiples of resources will be indicated by icons for nodes, CPU Threads, and accelerators. | - |
| Partition | main | The cluster partition this job was startet at | - |
| Start Timestamp | 10.1.2024, 10:00:00 | The epoch timestamp the job was started at, formatted for human readability | - |
| Duration | 0:21:10 | The runtime of the job, will be updated for running jobs on reload. Additionally indicates the state of the job as colored pill | - |
| Walltime | 24:00:00 | The allocated walltime for the job as per job submission script | - |
At the bottom, all tags attached to the job are listed. Users can manage attachted tags via the “manage X Tag(s)” button.
Concurrent Jobs
In the case of a shared job, a second tab next to the job info will display all jobs which were run on the same hardware at the same time. “At the same time” is defined as “has a starting or ending time which lies between the starting and ending time of the reference job” for this purpose.
A cautious period of five minutes is applied to both limits, in order to restrict display of jobs which have too little overlap, and would just clutter the resulting list of jobs.
Each overlapping job is listed with its jobId as a link leading to this jobs detailed job view.
Admin Note
Optional Tab that only shows if the supporting staff added a note to the job manually, or by the automatic tagging feature.
Usually contains information about notable job behaviours such as resource under-utilization.
Job Utilization Tabs
Footprint
Identical to the job list equivalent, this component will show base metrics for job performance at a glance, and will hint to job quality and problems in regard to configurable metric thresholds. In contrast to the job list, it is always active and shown in the detailed job view.
footprint flag is set in the respective metrics’ configuration will be shown in this view.Examples:
| Field | Description | Note |
|---|---|---|
| cpu_load | Average CPU utilization | - |
| flops_any | Floprate calculated as f_any = (f_double x 2) + f_single | - |
| mem_bw | Average memory bandwidth used | - |
| mem_used | Maximum memory used | Non-GPU Cluster only |
| acc_utilization | Average accelerator utilization | GPU Cluster Only |
Colors and icons differentiate between the different warning states based on the configured thresholds of the metrics. Reported metric values below the warning threshold simply report bad performance in one or more metrics, and should therefore be inspected by the user for future performance improvement.
Metric values colored in blue, however, usually report performance above the expected levels - Which is exactly why these metrics should be inspected as well. The “maximum” thresholds are often the theoretically achievable performance by the respective hardware component, but rarely are they actually reached. Inspecting jobs reporting back such levels can lead to averaging errors, unrealistic spikes in the metric data or even bugs in the code of ClusterCockpit.
| Color | Level | Description | Note |
|---|---|---|---|
| Blue | Info | Metric value below maximum configured peak threshold | Job performance above expected parameters - Inspection recommended |
| Green | OK | Metric value below normal configured threshold | Job performance within expected parameters |
| Yellow | Caution | Metric value below configured caution threshold | Job performance might be impacted |
| Red | Warning | Metric value below configured warning threshold | Job performance impacted with high probability - Inspection recommended |
| Dark Grey | Error | Metric value extremely above maximum configured threshold | Inspection required - Metric spikes in affected metrics can lead to errorneous average values |
Examples
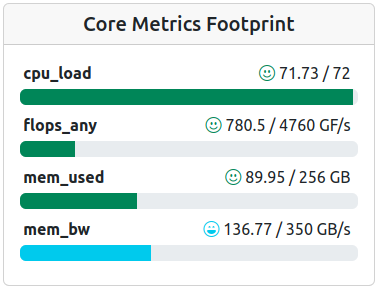
Footprint of a job with performance well within expected parameters, ‘mem_bw’ even overperforms.
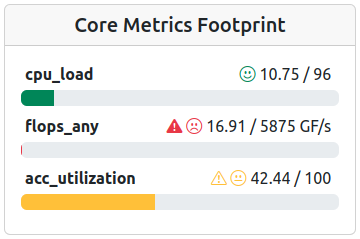
Footprint of an accelerated job with mixed performance parameters.
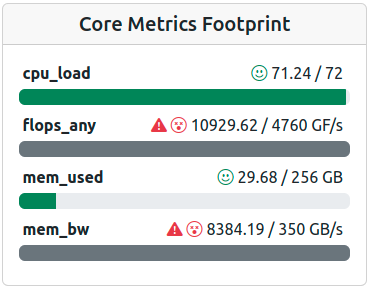
Footprint of a job with performance averages way above the expected maxima - Look for artifacts!
Polar Representation
Next to the footprints, a second tab will render the polar plot representation of the configured footprint metrics. Minimum, Average and Maximum ranges are rendered.
Roofline Representation
A roofline plot representing the utilization of available resources as the relation between computation and memory usage over time (color scale blue -> red). This plot is always shown separately.
Energy Summary
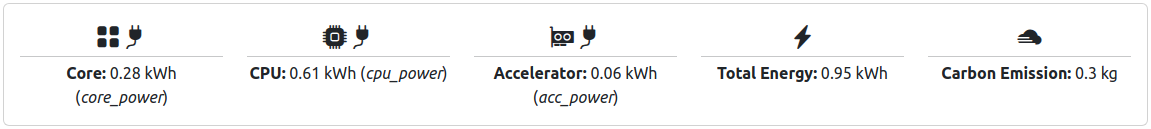
Energy Summary for a completed Job with Accelerators. Carbon Emission Estimate is activated.
For completed jobs, the energy estimates are shown below the top bar. Energy is shown in kilowatt hours for all contributing metrics. If a constant for g/kWh is configured, an additional estimate is calculated which displays the amount of carbon emissions.
Please note: Energy metrics displayed here are configured. All metrics, for which the energy flag is set in the respective metrics’ configuration will be shown in this view.
In addition, “Total Energy” is calculated as the sum of all configured metrics, regardless of their origin. I.e., if core_power and cpu_power are configured, both values contribute to the total energy.
Metric Plot Table
The views’ middle section consists of metric plots for each metric selected in the “Select Metrics” menu, which defaults to all configured metrics available to the jobs’ cluster and subCluster.
The data shown per metric defaults to the smallest available granularity of the metric with data of all nodes, but can be changed at will by using the drop down selectors above each plot.
If available, the statistical representation can be selected as well, by scope (e.g. stats series (node)).
Tagging
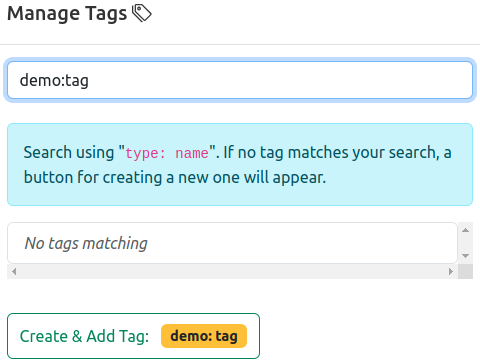
Manual tagging of jobs is performed by using the “Manage Tags” option.
Tags are categorized into three “Scopes” of visibility:
- Admin: Only administrators can create and attach these tags. Only visible for administrators and support personnel.
- Global: Administrators and support personnel can create and attach these tags. Visible for everyone.
- Private: Everyone can create and attach private tags, only visible to the creator.
Available tags are listed, colored by scope, and can be added to the jobs’ database entry simply by pressing the respective button.
The list can be filtered for specific tags by using the “Search Tags” prompt.
New tags can be created by entering a new type:name combination in the search prompt, which will display a button for creating this new tag. Privileged users](/docs/explanation/roles/#administrator-role “Admin Role”) will additionally be able to select the “Scope” (see above) of the new tag.
Statistics and Meta Data
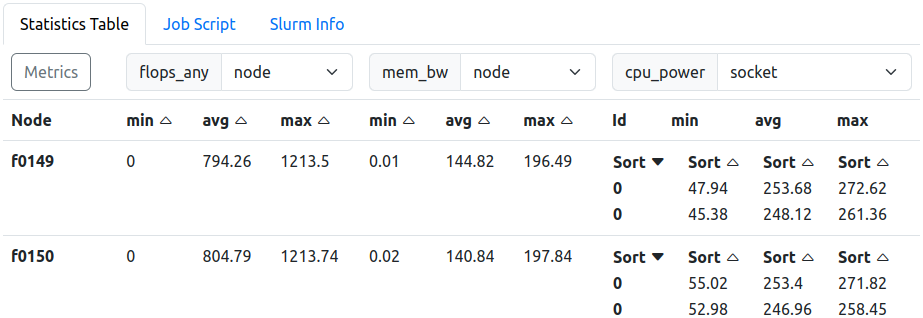
Statistics Table. ‘cpu_power’ granularity is set to ‘socket’. Tabs above switch the contents to the job script or slurm information, both read from the jobs metadata field.
On the bottom of the job view, additional information about the job is collected. By default, the statistics of selected metrics are shown in tabular form, each in their metrics’ native granularity. Metrics are selected independently for the statistics table.
Statistics Table
The statistics table collects all metric statistical values (min, max, avg) for each allocated node and each granularity.
The metrics to be displayed can be selected using the “Select Metrics” selection pop-up window. In the header, next to the metric name, a second drop down allows the selection of the displayed granularity. If no other scopes than node are available, the drop down menu is disabled.
Core and Accelerator metrics default to their respective native granularities automatically.
For multi-node jobs, fine granularities are not requested from the backend from the start. A “Load Scopes” will allow for the later load of more scopes, which will apply to all selected metrics in the statistics table, and also to metrics selected later.
Job Script
This tab displays the job script with which whis job was started on the systems.
Slurm Info
This tab displays information returned drom the SLURM batch process management software.
Missing Metrics or Resources
If mismatches between the supposed availability of metrics and the returned data are detected, an optional tab will list all details for missing metrics and/or missing hardware nodes, which were not found in the metricdata stores.
Feedback
Was this page helpful?
Glad to hear it! Please tell us how we can improve.
Sorry to hear that. Please tell us how we can improve.