Analysis
Categories:
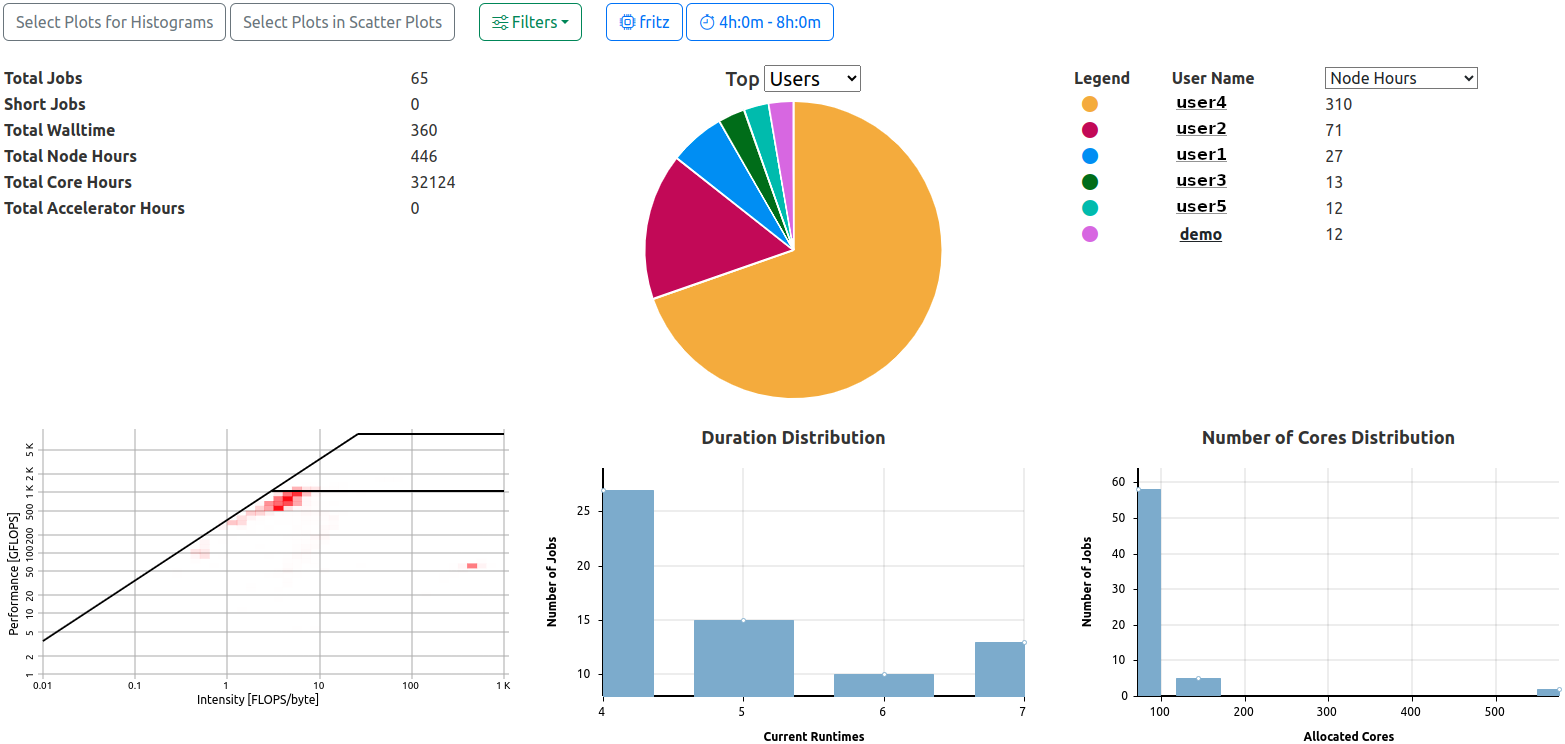
Analysis View General Information Section. Two filters are active, the pie chart displays top user node hour utilization fractions.
The analysis view is always called in respect to one specified cluster. It collects and renders data based on the jobs returned by the active filters, which can be specified to a high detail, allowing analysis of specific aspects.
General Information
The general information section of the analysis view is always rendered and consists of the following elements
Totals
Total counts of collected data based on the returned jobs matching the requested filters:
- Total Jobs
- Total Short Jobs (as defined by the configuration, default: less than 5 minute runtime)
- Total Walltime
- Total Node Hours
- Total Core Hours
- Total Accelerator Hours
Top Users and Projects
The ten most active users or projects are rendered in a combination of pie chart and tabular legend with values displayed. By default, the top ten users with the most jobs matching the selected filters will be shown.
Hovering over one of the pie chart fractions will display a legend featuring the identifier and value of the selected parameter.
The selection can be changed directly in the headers of the pie chart and the table, and can be changed to
| Element | Options |
|---|---|
| Pie Chart | Users, Projects |
| Table | Walltime, Node Hours, Core Hours, Accelerator Hours |
The selection is saved for each user and cluster, and will select the last chosen types of list as default the next time this view is opened.
“User Names” and “Project Codes” are rendered as links, leading to user job lists or project job lists with preset filters for cluster and entity ID.
Heatmap Roofline
A roofline plot representing the utilization of available resources as the relation between computation and memory for all jobs matching the filters. In order to represent the data in a meaningful way, the time information of the raw data is abstracted and represented as a heat map, with increasingly red sections of the roofline plot being the most populated regions of utilization.
Histograms
Two histograms depicting the duration and number of allocated cores distributions for the returned jobs matching the filters.
Selectable Data Representations

The second half of the analysis view consists of areas reserved for rendering user-selected data representations.
- Select Plots for Histograms: Opens a selector listing all configured metrics of the respective cluster. One or more metrics can be selected, and the data returned will be rendered as average distributions normalized by node hours (core hours, accelerator hours; depending on the metric).
- Select Plots in Scatter Plots: Opens a selector which allows selection of user chosen combinations of configured metrics for the respective cluster. Selected duplets will be rendered as scatter bubble plots for each selected pair of metrics.
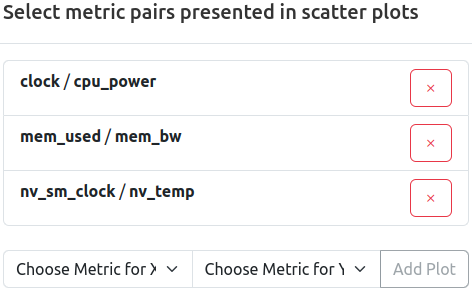
Three pairs of metrics are already selected for scatter representation. Remove a selected pair by pressing the ‘x’ button, add a new pair by selecting two metric from the dropdown menu, and confirming by pressing ‘Add Plot’.
Average Distribution Histograms
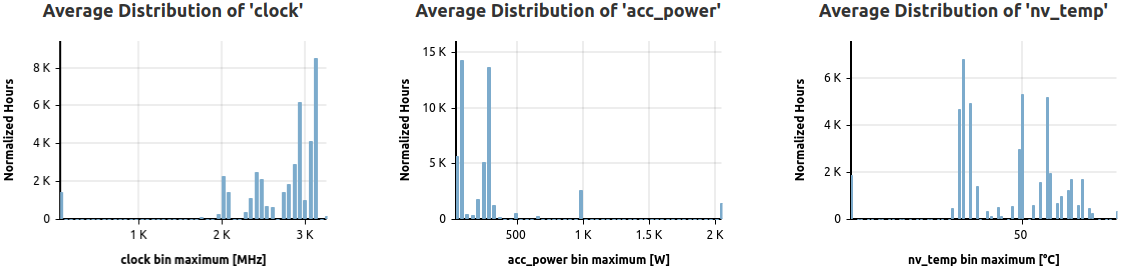
Three selected metrics are represented as normalized, average distributions based on returned jobs.
These histograms show the distribution of the normalized averages of all jobs matching the filters, split into 50 bins for high detail.
Normalization is achieved by weighting the selected metric data job averages by node hours (default), or by either accelerator hours (for native accelerator scope metrics) or core hours (for native core scope metrics).
User Defined Scatterplots
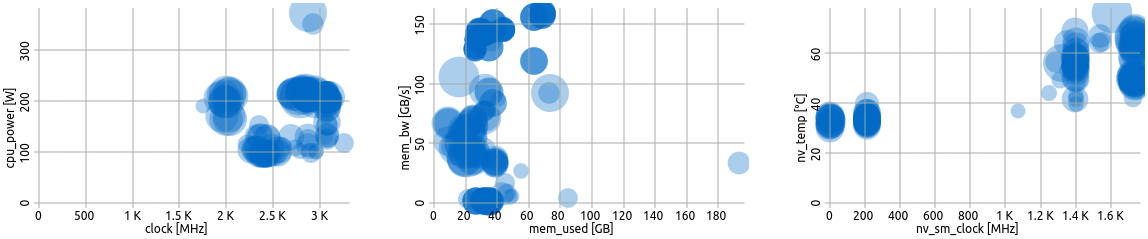
Three user defined scatter plots.
Bubble scatter plots show the position of the averages of two selected metrics in relation to each other.
Each circle represents one job, while the size of a circle is proportional to its node hours. Darker circles mean multiple jobs have the same averages for the respective metric selection.
Feedback
Was this page helpful?
Glad to hear it! Please tell us how we can improve.
Sorry to hear that. Please tell us how we can improve.