Usage descriptions for each view of the ClusterCockpit web interface.
This is the multi-page printable view of this section. Click here to print.
Views
View-Specific Frontend Usage Information.
- 1: My Jobs
- 2: User Jobs
- 3: Job List
- 4: Job Comparison
- 5: Job
- 6: Users
- 7: Projects
- 8: Tags
- 9: Nodes
- 10: Node
- 11: Analysis
- 12: Status
1 - My Jobs
All Jobs as Table of the Active User
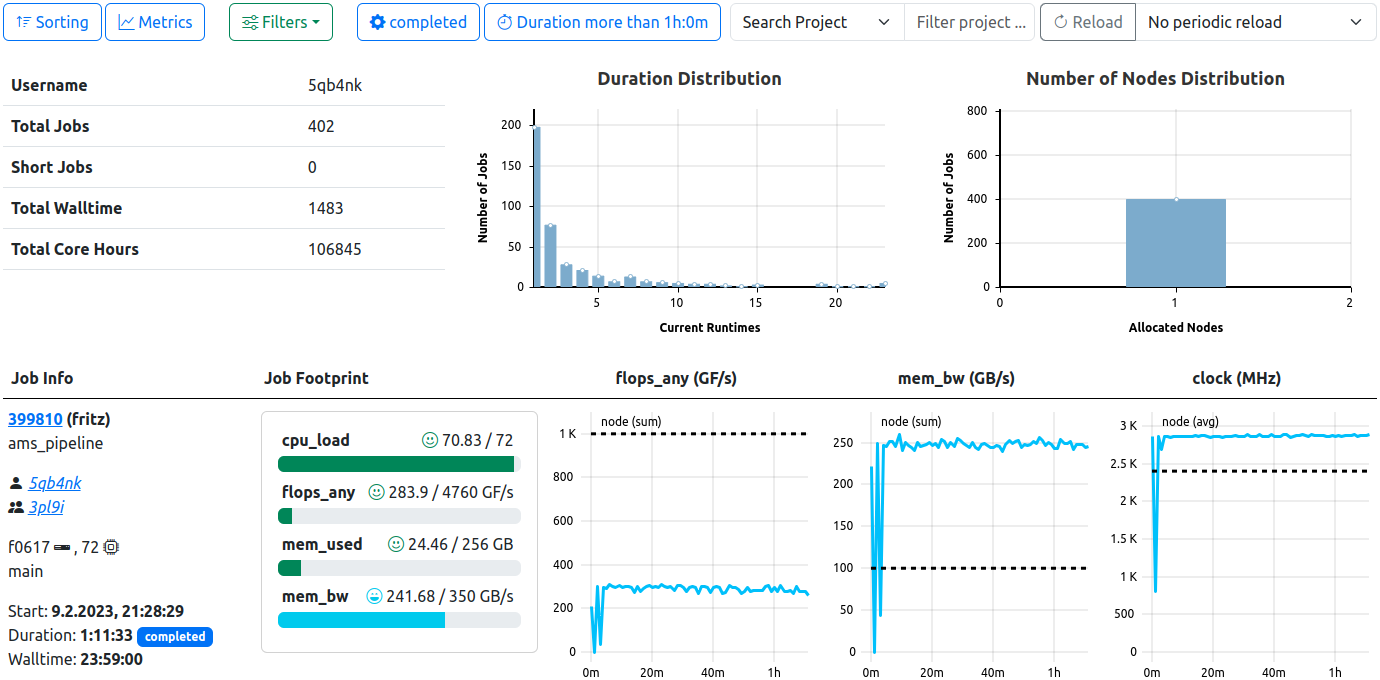
Personal User Job View. Similar to the general job list view, this view expands it by user-specific meta data, as well as distributions histograms.
The “My Jobs” View is available to all users regardless of authority and displays the users personal jobs, i.e. jobs started by this users username on the cluster systems.
The view is a personal variant of the user job view and therefore also consists of three components: Basic Information about the users jobs, selectable statistic histograms of the jobs, and a generalized job list.
Users are able to change the sorting, select and reorder the rendered metrics, filter, and activate a periodic reload of the data.
User Information and Basic Distributions
The top row always displays personal usage information, independent of the selected filters. Information displayed:
- Username
- Person Name (if available in DB)
- Total Jobs
- Short Jobs (as defined by the configuration, default: less than 5 minute runtime)
- Total Walltime
- Total Core Hours
Additional histograms depicting the distribution of job duration and number of nodes occupied by the returned jobs are affected by the selected filters. The binning of the duration histogram can be selected by the user. The options are as follows:
| Bin Size | Number of Bins | Maximum Displayed Duration |
|---|---|---|
| 1 Minute (1m) | 60 | 1 Hour |
| 10 Minute (10m) | 72 | 12 Hours |
| 1 Hour (1h, Default) | 48 | 2 Days |
| 6 Hours (6h) | 12 | 3 Days |
| 12 Hours (12h) | 14 | 1 Week |
Selectable Histograms
Histograms depicting the distribution of the selected jobs’ statistics can be selected from the top navbar “Select Histograms” button. The displayed data is based on the jobs returned from active filters, and will be pulled from the database.
The binning of the statistics histograms can be selected by the user, the bin limits are calculated automatically.
The options are as follows: 10 (Default), 20, 50, 100.
Please note: Metrics statistics listed here for selection are configured. All metrics, for which the
footprint flag is set in the respective metrics’ configuration will be available here.Job List
The job list displays all jobs started by your username on the systems. Additional filters will always respect this limitation. For a detailed description of the job list component, see the related documentation.
Job Compare
The job list also allows comparison of either user selected jobs or of all job listed, if the total number of jobs does not exceed 500 matches. For a detailed description of the job list component, see the related documentation.
2 - User Jobs
All Jobs as Table of a Selected User
User Job View. Similar to the general job list view, this view expands it by user-specific meta data, as well as distribution histograms.
The “User Jobs” View is only available to management and supporting staff and displays jobs belonging to a single user other than the active user, i.e. jobs started by other users on the cluster systems can be reviewed in detail by the supporting staff or administrators.
The view consists of three components: Basic Information about the users jobs, selectable statistic histograms of the jobs, and a generalized job list.
Users are able to change the sorting, select and reorder the rendered metrics, filter, and activate a periodic reload of the data.
User Information and Basic Distributions
The top row always displays information about the user, independent of the selected filters.
Information displayed:
- Username
- Person Name (if available in DB)
- Total Jobs
- Short Jobs (as defined by the configuration, default: less than 5 minute runtime)
- Total Walltime
- Total Core Hours
Additional histograms depicting the distribution of job duration and number of nodes occupied by the returned jobs are affected by the selected filters. The binning of the duration histogram can be selected by the user. The options are as follows:
| Bin Size | Number of Bins | Maximum Displayed Duration |
|---|---|---|
| 1 Minute (1m) | 60 | 1 Hour |
| 10 Minute (10m) | 72 | 12 Hours |
| 1 Hour (1h, Default) | 48 | 2 Days |
| 6 Hours (6h) | 12 | 3 Days |
| 12 Hours (12h) | 14 | 1 Week |
Selectable Histograms
Histograms depicting the distribution of the selected jobs’ statistics can be selected from the top navbar “Select Histograms” button. The displayed data is based on the jobs returned from active filters, and will be pulled from the database.
The binning of the statistics histograms can be selected by the user, the bin limits are calculated automatically.
The options are as follows: 10 (Default), 20, 50, 100.
Please note: Metrics statistics listed here for selection are configured. All metrics, for which the
footprint flag is set in the respective metrics’ configuration will be available here.Job List
The job list displays all jobs started by this users username on the systems. Additional filters will always respect this limitation. For a detailed description of the job list component, see the related documentation.
Job Compare
The job list also allows comparison of either user selected jobs or of all job listed, if the total number of jobs does not exceed 500 matches. For a detailed description of the job list component, see the related documentation.
3 - Job List
A Configurable Table Displaying Jobs According to Filters
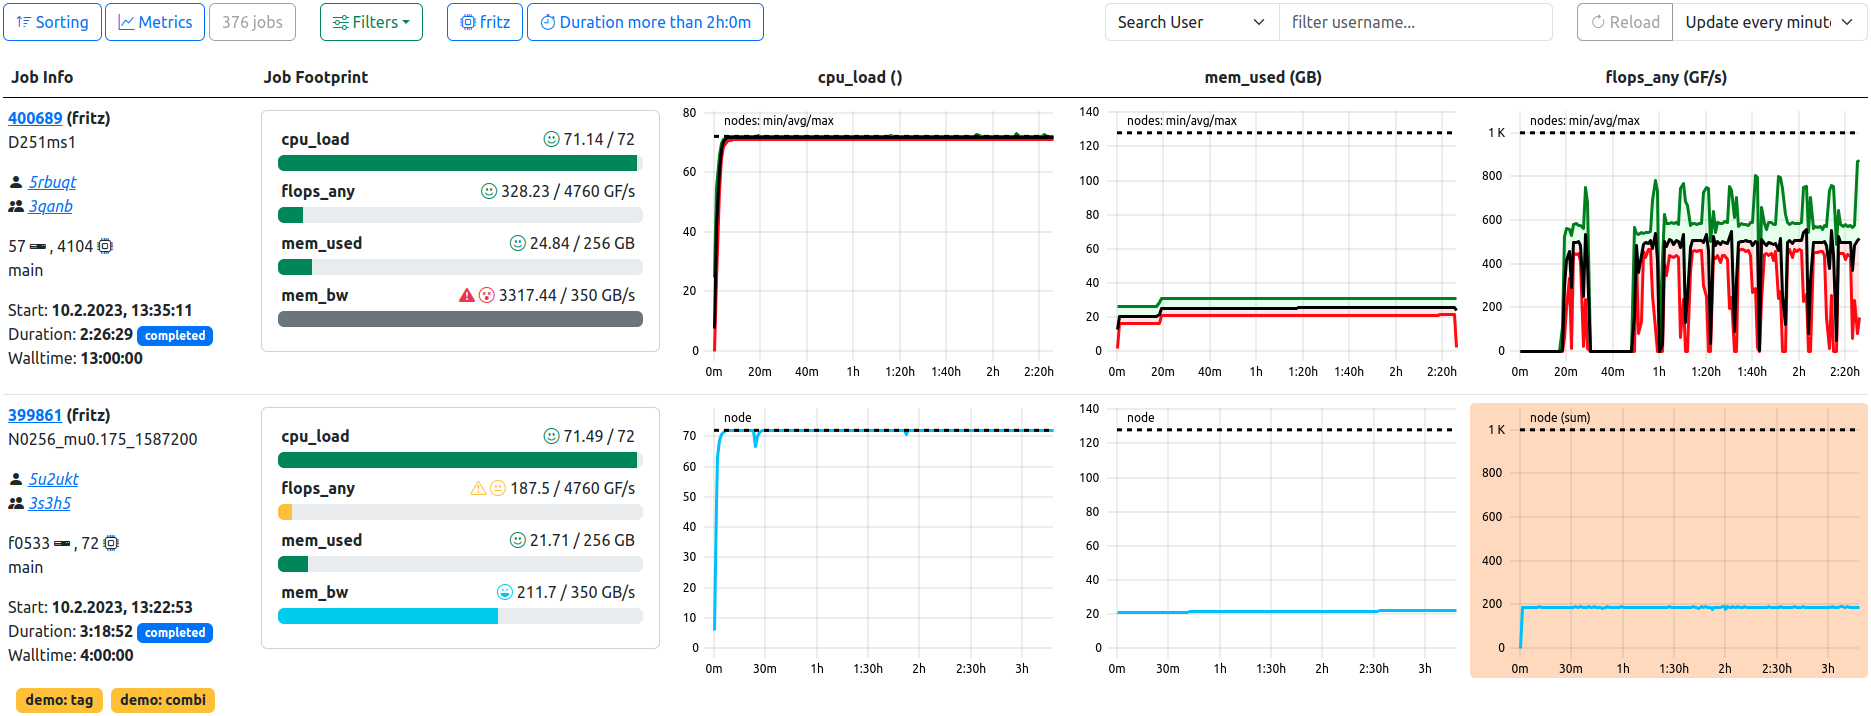
Job List. In this example, the optional footprint is displayed, two filters are active, and the table is refreshed every minute. The first job has a high node count, therefore the plots are rendered in the statistics variant. The ‘mem_bw’ metric likely has artifacts as shown by the grey footprint. The second job has tags and displays less than optimal performance in the ‘flops_any’ metric, coloring the respective plot background in orange.
The primary view of ClusterCockpits webinterface is the tabular listing of jobs, which displays various information about the jobs returned by the selected filters. This information includes the jobs’ full meta data, such as runtime or job state, as well as an optional footprint, allowing quick assessment of the jobs performance.
Most importantly, the list displays a selectable array of metrics as time dependent metric plots, which allows detailed insight into the jobs performance at a glance.
Default Users: For users without additional roles, this view is labelled as ‘Job Search’. Displayed jobs are limited to jobs started by the active user, otherwise the functionality is identical, e.g. filtering or footprint display.
Manager Users: For users with additional
manager role, this view is labelled as ‘Managed Jobs’. Displayed jobs are limited to jobs started by users of the managed projects (usergroups), otherwise the functionality is identical, e.g. filtering or footprint display.Job List Toolbar

Several options allow configuration of the displayed data, which are also persisted for each user individually, either for general usage or by cluster.
Sorting
Basic selection of sorting parameter and direction. By default, jobs are sorted by starting timestamp in descending order (latest jobs first). Other selections to sort by are
- Duration
- Number of Nodes
- Number of Hardware-Threads
- Number of Accelerators
- Total Energy Consumed
- Additional configured Metric Statistics
- …
Please note: Additional metrics statistics are configured. All metrics, for which the
footprint flag is set in the respective metrics’ configuration will be available as additional sorting options.Switching of the sort direction is achieved by clicking on the arrow icon next to the desired sorting parameter.
Metrics
Selection of metrics shown in the tabular view for each job. The list is compiled from all available configured metrics of the ClusterCockpit instance, and the tabular view will be updated upon applying the changes.
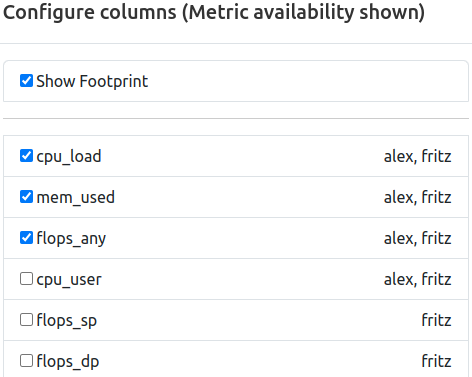
In addition to the metric names themselves, the availability by cluster is indicated as comma seperated list next to the metric identifier. This information will change to the availablility by partition if the cluster filer is active.
It is furthermore possible to edit the order of the selected metrics. This can be achieved by dragging and dropping the metric selectors to the desired order, where the topmost metric will be displayed next to the “Job Info” column, and additional metrics will be added on the right side.
Lastly, the optional “Footprint” Column can be activated (and deactivated) here. It will always be rendered next to the “Job Info” column, while metrics start right of the “Footprint” column, if activated.
Filters
Selection of filters applied to the queried jobs. By default, no filters are activated if the view was opened via the navigation bar. At multiple location throughout the web-interface, direct links will lead to this view with one or more preset filters active, e.g. selecting a clusters’ “running jobs” from the home page will open this view displaying only running jobs of that cluster.
Possible options are:
- Cluster/Partition: Filter by configured cluster (and partitions thereof)
- Job State: Filter by defined job state(s)
- Start Time: Filter by start timestamp
- Duration: Filter by job duration
- Tags: Filter by tags assigned to jobs
- Resources: Filter by allocated resources or named node
- Energy: Filter by consumed total energy (for completed jobs only)
- Statistics: Filter by average usage of defined metrics
Each filter and its default value is described in detail here.
Job Count
The total number of jobs returned by the backend for the given set of filters.
Search and Reload
Search for specific jobname, project or username (privileged only) using the searchbox by selecting from the dropdown and entering the query.
Force a complete reload of the table data, or set a timed periodic reload (30, 60, 120, 300 Seconds).
Search for specific project

If the Job-List was opened via a ProjectId-Link or the Projects List, the text search will be fixed to the selected project, and allows for filtering jobnames and users in that project, as indicated by the placeholder text.
If desired, the fixed project can be removed by pressing the button right of the input field, returning the joblist to its default state.
Compare Jobs
This button is used to compare either a selected number of jobs or all jobs currently matching the selected filters by switching to the job comparison view.
Users can select the to be compared jobs in the [job info](#job-info section via the selector checkbox in the upper right corner. Alternatively, every combination of job list filters can be used to generate a comparison set.
Please Note: The button will be disabled if the total amount of to be compared jobs exceeds 500 matches.
Job List Table
The main component of the job list view renders data pulled from the database, the job archive (completed jobs) and the configured metric data source (running jobs).
Job Info
The meta data containing general information about the job is represented in the “Job Info” column, which is always the first column to be rendered. From here, users can navigate to the detailed view of one specific job as well as the user or project specific job lists.
| Field | Example | Description | Destination |
|---|---|---|---|
| Job Id | 123456 | The JobId of the job assigned by the scheduling daemon | Job View |
| Job Name | myJobName | The name of the job as supplied by the user | - |
| Username | abcd10 | The username of the submitting user | User Jobs |
| Project | abcd | The name of the usergroup the submitting user belongs to | Joblist with preset Filter |
| Resources | n100 | Indicator for the allocated resources. Single resources will be displayed by name, i.e. exclusive single-node jobs or shared resources. Multiples of resources will be indicated by icons for nodes, CPU Threads, and accelerators. | - |
| Partition | main | The cluster partition this job was startet at | - |
| Start Timestamp | 10.1.2024, 10:00:00 | The epoch timestamp the job was started at, formatted for human readability | - |
| Duration | 0:21:10 | The runtime of the job, will be updated for running jobs on reload. Additionally indicates the state of the job as colored pill | - |
| Walltime | 24:00:00 | The allocated walltime for the job as per job submission script | - |
Two additional functions are located in the upper right corner of each job information segment for each job, namely, a helper to easily copy the respective job ID to the clipboard as well as the selector checkbox to mark the respective job for job comparison (see above).
Footprint
The optional footprint column will show base metrics for job performance at a glance, and will hint to performance (and performance problems) in regard to configurable metric thresholds.
Please note: Metric statistics displayed here are configured. All metrics, for which the
footprint flag is set in the respective metrics’ configuration will be shown in this view.Examples:
| Field | Description | Note |
|---|---|---|
| cpu_load | Average CPU utilization | - |
| flops_any | Floprate calculated as f_any = (f_double x 2) + f_single | - |
| mem_bw | Average memory bandwidth used | Non-GPU Cluster only |
| mem_used | Maximum memory used | Non-GPU Cluster only |
| acc_utilization | Average accelerator utilization | GPU Cluster Only |
Colors and icons differentiate between the different warning states based on the configured threshold of the metrics. Reported metric values below the warning threshold simply report bad performance in one or more metrics, and should therefore be inspected by the user for future performance improvement.
Metric values colored in blue, however, usually report performance above the expected levels - Which is exactly why these metrics should be inspected as well. The “maximum” thresholds are often the theoretically achievable performance by the respective hardware component, but rarely are they actually reached. Inspecting jobs reporting back such levels can lead to averaging errors, unrealistic spikes in the metric data or even bugs in the code of ClusterCockpit.
| Color | Level | Description | Note |
|---|---|---|---|
| Blue | Info | Metric value below maximum configured peak threshold | Job performance above expected parameters - Inspection recommended |
| Green | OK | Metric value below normal configured threshold | Job performance within expected parameters |
| Yellow | Caution | Metric value below configured caution threshold | Job performance might be impacted |
| Red | Warning | Metric value below configured warning threshold | Job performance impacted with high probability - Inscpection recommended |
| Dark Grey | Error | Metric value extremely above maximum configured threshold | Inspection required - Metric spikes in affected metrics can lead to errorneous average values |
For examples, see images in the job view section.
Metric Row
Selected metrics are rendered here in the selected order as metric lineplots. Aspects of the rendering can be configured at the settings page.
4 - Job Comparison
Compare Job Metric Statistics
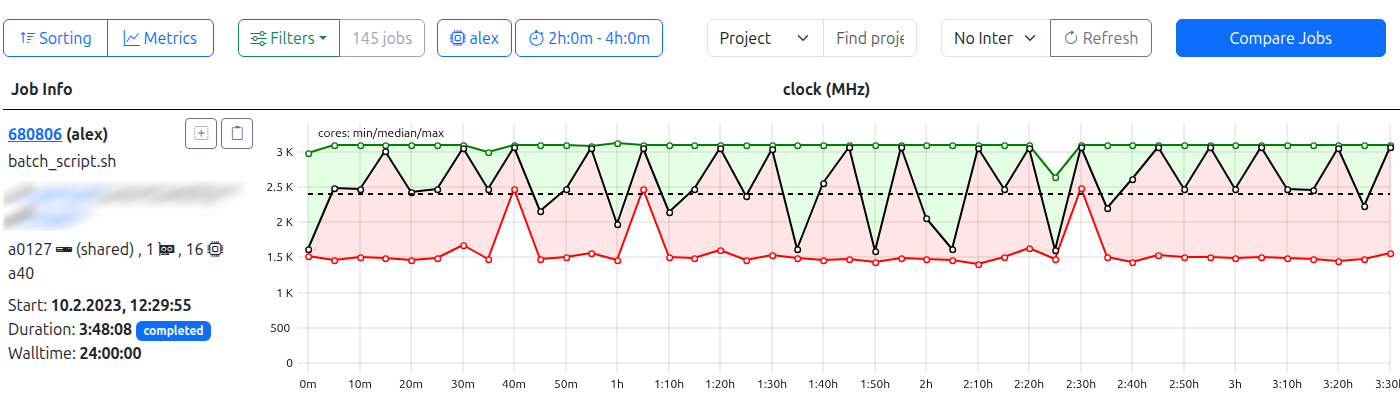
Job list with compare switch. In this example, filters return 145 jobs, while no job is selected manually.
Accessible from the general job list as well as the user view job lists, the job compare view allows for the comparison of metric statistics in a pseudo-time-dependent manner.
The “Compare Jobs” button is located in the upper right corner of the job list views. Jobs for comparison are either selected by
- … a combination of filters resulting in a dataset of 500 jobs or less.
- … manual job selection by checking the box in the job info card.
If too many jobs are returned by the current filter selection, the button will be disabled.
If jobs are directly selected from the current job list, the button will display the current count, as well as an additional “Reset” button, which will empty the list of selected jobs, if pressed.
Manual job selection will also work if the current job list has more than 500 returned jobs, while the subsequent job compare view will ignore all additional filters, and only show selected jobs. Returning to the job list also returns with the last used filters.
This allows manual job selection between pages, but also manual job selection between different filter combinations!
Fixed Compare Elements
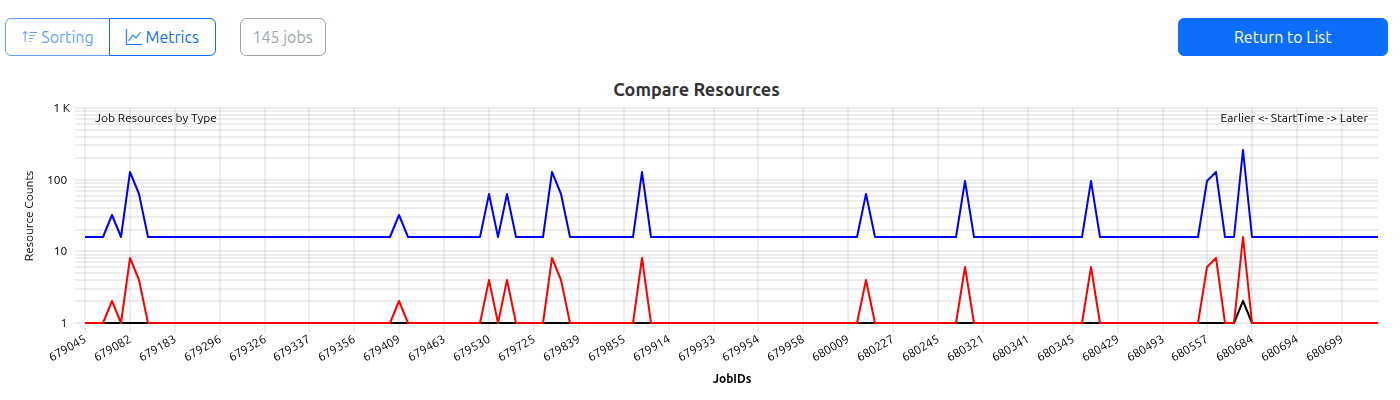
Job compare view top elements. The count of 145 jobs remains after switching to this view. The resource plot shows jobs sorted by their startTime, and all jobs have allocated accelerators (red data line).
The compare view features a reduced header:
- Sorting is disabled, as jobs are always sorted by
startTimein ascending order. - The filter component is removed and only shows the total number of compared jobs.
- The refresh component is also removed.
The “Metric Selection” is active and can be used to add additional metric comparison plots to the view, if desired.
“Return to List” closes the compare view and restores the former job list view.
The resource compare plot is always shown at the first position. It features a semi-logarithmic view of allocated job resources in a pseudeo-time-dependent manner, as all jobs are sorted by actual start time. The data is colored as follows:
- Black: Nodes - will always be at least
1(Note: Also for shared jobs!) - Blue: Hardware Threads ( ~ Cores)
- Red: Accelerators - Can be zero! If so, no line is rendered.
The legend includes further information, such as:
- Job-ID
- Cluster (and subCluster) on which the job ran
- Runtimeof the job
Selectable Compare Elements
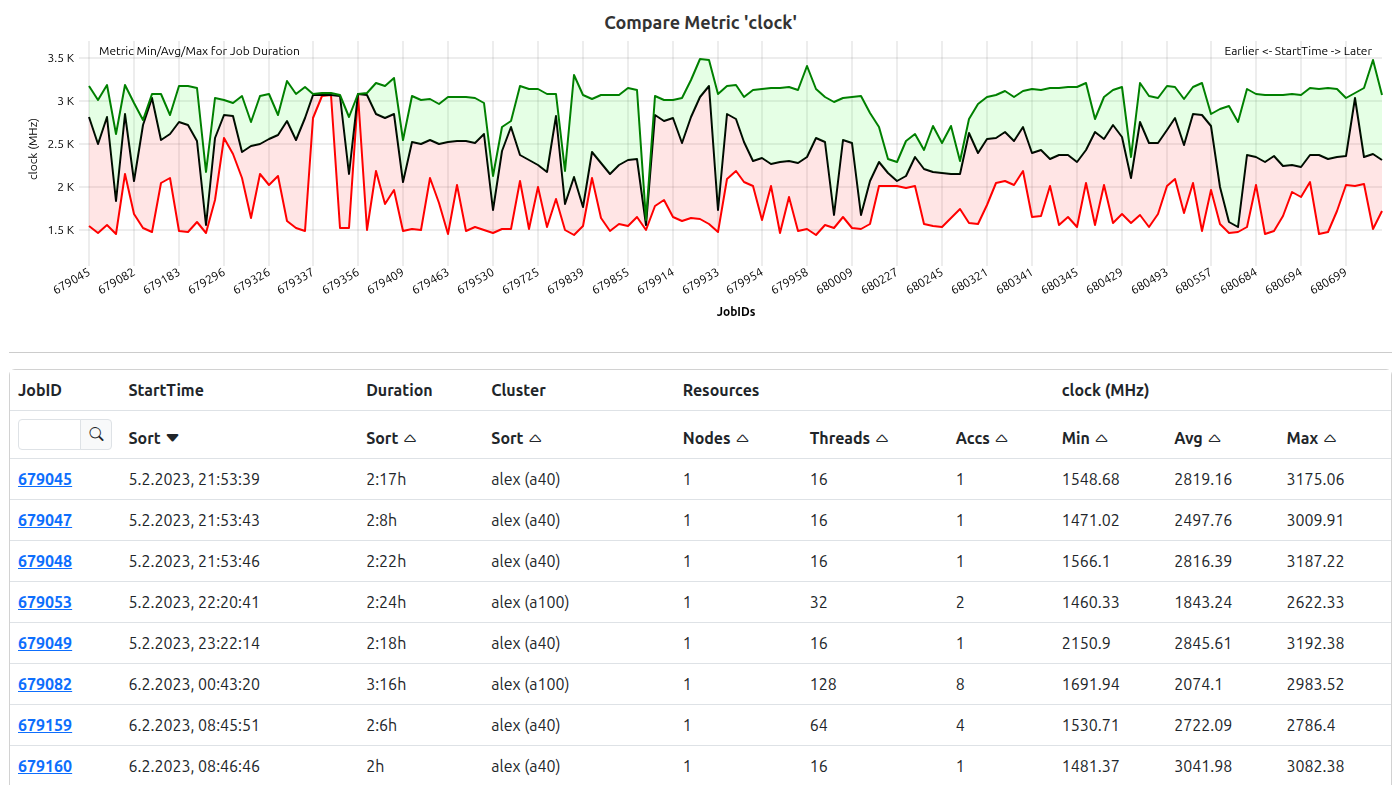
Job compare view metric plot and table. ‘Clock’ metric statistics are plotted for every job sorted by their startTime. All information is also shown as sortable table at the bottom of the compare view.
Below the first plot, the individual metric compare plots are rendered. For each job, the Min/Max/Avg of the respective metric is plotted in a banded manner.
Zooming is possible, and will be synchronized to all other rendered plots, including the resource comparison.
Please Note: Due to spacing reasons, not all jobIDs can be rendered as tick-marks if the total count of compared jobs is high!
Below the plots, all information is again rendered as a single table consisting of the following columns:
- JobID
- Start Time
- Duration
- Cluster
- Resources (Nodes, Threads , Accs)
- For each Metric: Minimum, Maximum, Average
It is possible to filter for specific jobIDs or parts thereof, all other columns are sortable.
Clicking on a JobID will lead to the respective Job View.
5 - Job
Detailed Single Job Information View
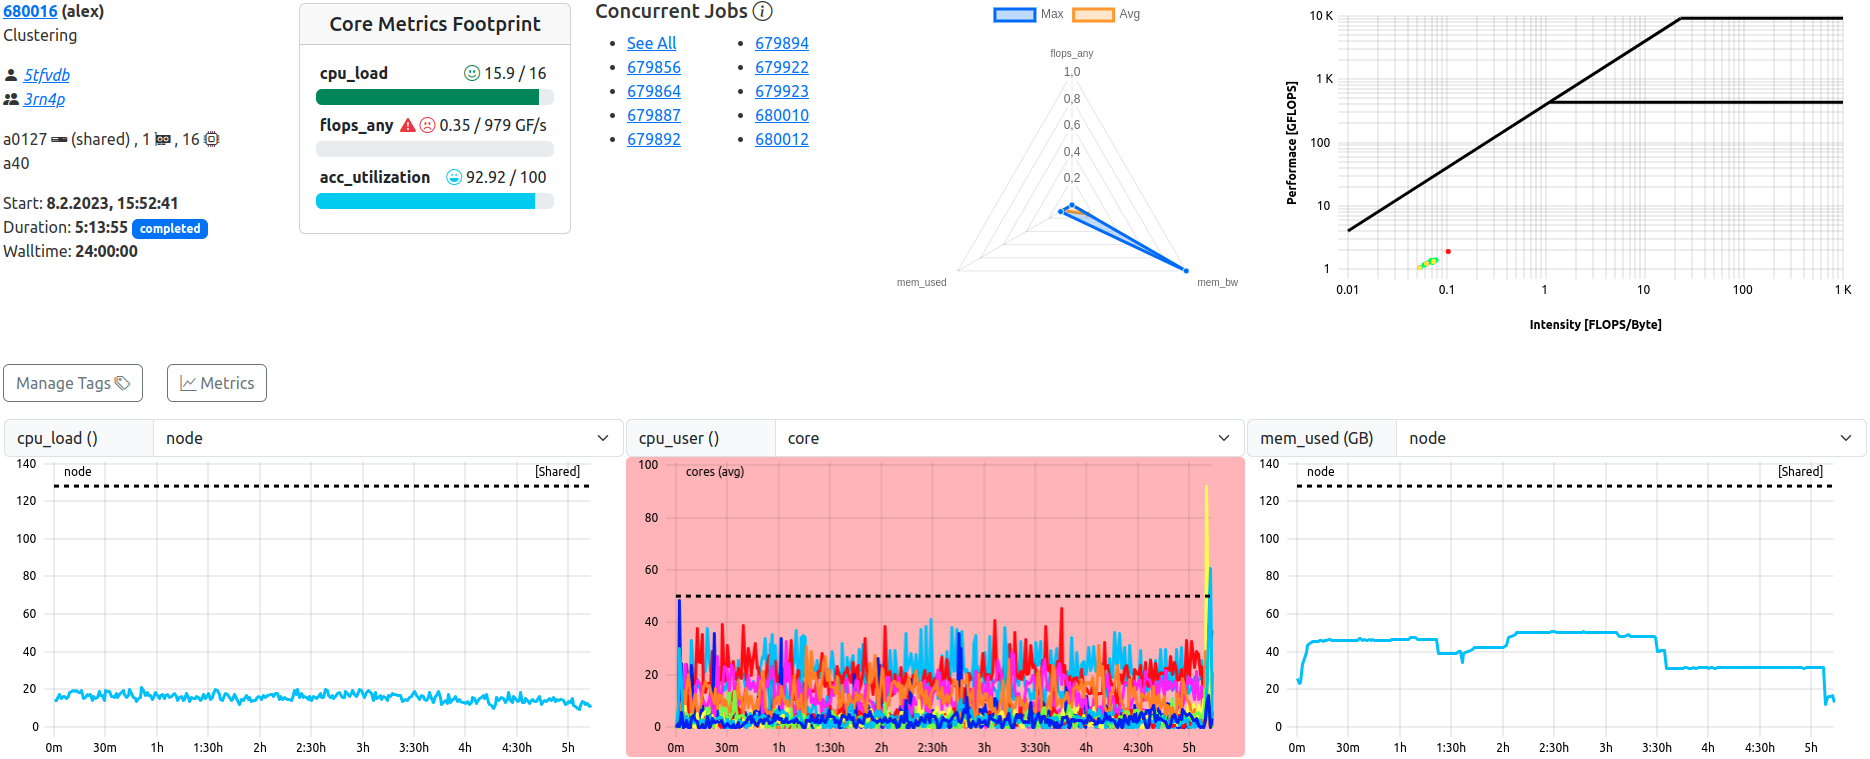
Job View. This example shows a completed, shared job with lacking ‘flops_any’ performance.
The job view displays all data related to one specific job in full detail, and allows detailed inspection of all metrics at several scopes, as well as manual tagging of the job.
Top Bar
The top bar of each job view replicates the “Job Info” and “Footprint” seen in the job list, and additionally renders general metric information in specialized plots.
For shared jobs, a list of jobs which run (or ran) concurrently is shown as well.
Job Information Tabs
Job Info
Identical to the job list equivalent, this component displays meta data containing general information about the job. From here, users can navigate to the detailed view of one specific job as well as the user or project specific job lists.
| Field | Example | Description | Destination |
|---|---|---|---|
| Job Id | 123456 | The JobId of the job assigned by the scheduling daemon. The icon on the right allows for easy copy to clipboard. | Job View |
| Job Name | myJobName | The name of the job as supplied by the user | - |
| Username | abcd10 | The username of the submitting user | User Jobs |
| Project | abcd | The name of the usergroup the submitting user belongs to | Joblist with preset Filter |
| Resources | n100 | Indicator for the allocated resources. Single resources will be displayed by name, i.e. exclusive single-node jobs or shared resources. Multiples of resources will be indicated by icons for nodes, CPU Threads, and accelerators. | - |
| Partition | main | The cluster partition this job was startet at | - |
| Start Timestamp | 10.1.2024, 10:00:00 | The epoch timestamp the job was started at, formatted for human readability | - |
| Duration | 0:21:10 | The runtime of the job, will be updated for running jobs on reload. Additionally indicates the state of the job as colored pill | - |
| Walltime | 24:00:00 | The allocated walltime for the job as per job submission script | - |
At the bottom, all tags attached to the job are listed. Users can manage attachted tags via the “manage X Tag(s)” button.
Concurrent Jobs
In the case of a shared job, a second tab next to the job info will display all jobs which were run on the same hardware at the same time. “At the same time” is defined as “has a starting or ending time which lies between the starting and ending time of the reference job” for this purpose.
A cautious period of five minutes is applied to both limits, in order to restrict display of jobs which have too little overlap, and would just clutter the resulting list of jobs.
Each overlapping job is listed with its jobId as a link leading to this jobs detailed job view.
Admin Note
Optional Tab that only shows if the supporting staff added a note to the job manually, or by the automatic tagging feature.
Usually contains information about notable job behaviours such as resource under-utilization.
Job Utilization Tabs
Footprint
Identical to the job list equivalent, this component will show base metrics for job performance at a glance, and will hint to job quality and problems in regard to configurable metric thresholds. In contrast to the job list, it is always active and shown in the detailed job view.
Please note: Metric statistics displayed here are configured. All metrics, for which the
footprint flag is set in the respective metrics’ configuration will be shown in this view.Examples:
| Field | Description | Note |
|---|---|---|
| cpu_load | Average CPU utilization | - |
| flops_any | Floprate calculated as f_any = (f_double x 2) + f_single | - |
| mem_bw | Average memory bandwidth used | - |
| mem_used | Maximum memory used | Non-GPU Cluster only |
| acc_utilization | Average accelerator utilization | GPU Cluster Only |
Colors and icons differentiate between the different warning states based on the configured thresholds of the metrics. Reported metric values below the warning threshold simply report bad performance in one or more metrics, and should therefore be inspected by the user for future performance improvement.
Metric values colored in blue, however, usually report performance above the expected levels - Which is exactly why these metrics should be inspected as well. The “maximum” thresholds are often the theoretically achievable performance by the respective hardware component, but rarely are they actually reached. Inspecting jobs reporting back such levels can lead to averaging errors, unrealistic spikes in the metric data or even bugs in the code of ClusterCockpit.
| Color | Level | Description | Note |
|---|---|---|---|
| Blue | Info | Metric value below maximum configured peak threshold | Job performance above expected parameters - Inspection recommended |
| Green | OK | Metric value below normal configured threshold | Job performance within expected parameters |
| Yellow | Caution | Metric value below configured caution threshold | Job performance might be impacted |
| Red | Warning | Metric value below configured warning threshold | Job performance impacted with high probability - Inspection recommended |
| Dark Grey | Error | Metric value extremely above maximum configured threshold | Inspection required - Metric spikes in affected metrics can lead to errorneous average values |
Specific to the job view: In the job view, the footprint component also allows for 1:1 rendering of HTML code, saved within the jobs’ meta data section of the database. This is intended for administrative messages towards the user who created the job, e.g. for displaying warning, hints, or contact information.
Examples
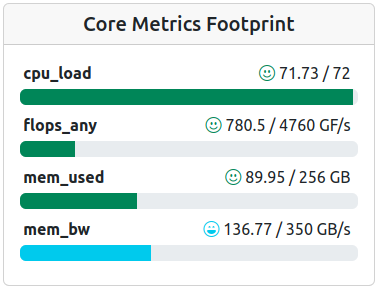
Footprint of a job with performance well within expected parameters, ‘mem_bw’ even overperforms.
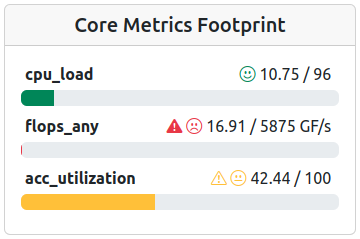
Footprint of an accelerated job with mixed performance parameters.
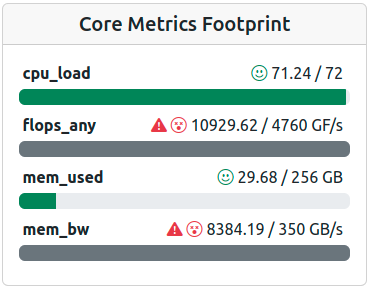
Footprint of a job with performance averages way above the expected maxima - Look for artifacts!
Polar Representation
Next to the footprints, a second tab will render the polar plot representation of the configured footprint metrics. Minimum, Average and Maximum ranges are rendered.
Roofline Representation
A roofline plot representing the utilization of available resources as the relation between computation and memory usage over time (color scale blue -> red). This plot is always shown separately.
Energy Summary
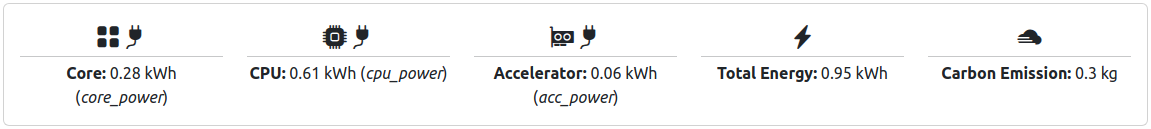
Energy Summary for a completed Job with Accelerators. Carbon Emission Estimate is activated.
For completed jobs, the energy estimates are shown below the top bar. Energy is shown in kilowatt hours for all contributing metrics. If a constant for g/kWh is configured, an additional estimate is calculated which displays the amount of carbon emissions.
Please note: Energy metrics displayed here are configured. All metrics, for which the energy flag is set in the respective metrics’ configuration will be shown in this view.
In addition, “Total Energy” is calculated as the sum of all configured metrics, regardless of their origin. I.e., if core_power and cpu_power are configured, both values contribute to the total energy.
Metric Plot Table
The views’ middle section consists of metric plots for each metric selected in the “Select Metrics” menu, which defaults to all configured metrics available to the jobs’ cluster and subCluster.
The data shown per metric defaults to the smallest available granularity of the metric with data of all nodes, but can be changed at will by using the drop down selectors above each plot.
If available, the statistical representation can be selected as well, by scope (e.g. stats series (node)).
Please note: The backend will calculate and return a statistical data series if the underlying metric dataset has at least 15 data series, e.g. a job utilizing 15 or more cores.
Tagging
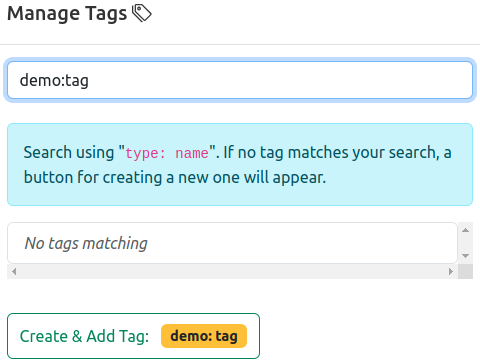
Manual tagging of jobs is performed by using the “Manage Tags” option.
Tags are categorized into three “Scopes” of visibility:
- Admin: Only administrators can create and attach these tags. Only visible for administrators and support personnel.
- Global: Administrators and support personnel can create and attach these tags. Visible for everyone.
- Private: Everyone can create and attach private tags, only visible to the creator.
Available tags are listed, colored by scope, and can be added to the jobs’ database entry simply by pressing the respective button.
The list can be filtered for specific tags by using the “Search Tags” prompt.
New tags can be created by entering a new type:name combination in the search prompt, which will display a button for creating this new tag. Privileged users](/docs/explanation/roles/#administrator-role “Admin Role”) will additionally be able to select the “Scope” (see above) of the new tag.
Statistics and Meta Data
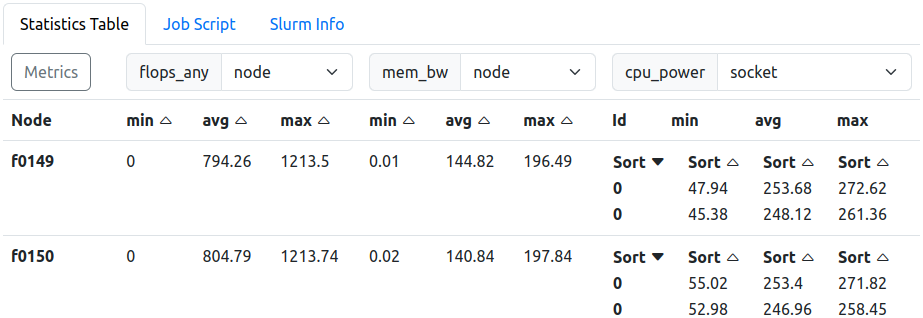
Statistics Table. ‘cpu_power’ granularity is set to ‘socket’. Tabs above switch the contents to the job script or slurm information, both read from the jobs metadata field.
On the bottom of the job view, additional information about the job is collected. By default, the statistics of selected metrics are shown in tabular form, each in their metrics’ native granularity. Metrics are selected independently for the statistics table.
Statistics Table
The statistics table collects all metric statistical values (min, max, avg) for each allocated node and each granularity.
The metrics to be displayed can be selected using the “Select Metrics” selection pop-up window. In the header, next to the metric name, a second drop down allows the selection of the displayed granularity. If no other scopes than node are available, the drop down menu is disabled.
Core and Accelerator metrics default to their respective native granularities automatically.
For multi-node jobs, fine granularities are not requested from the backend from the start. A “Load Scopes” will allow for the later load of more scopes, which will apply to all selected metrics in the statistics table, and also to metrics selected later.
Job Script
This tab displays the job script with which whis job was started on the systems.
Slurm Info
This tab displays information returned drom the SLURM batch process management software.
Missing Metrics or Resources
If mismatches between the supposed availability of metrics and the returned data are detected, an optional tab will list all details for missing metrics and/or missing hardware nodes, which were not found in the metricdata stores.
6 - Users
Table of All Users Running Jobs on the Clusters
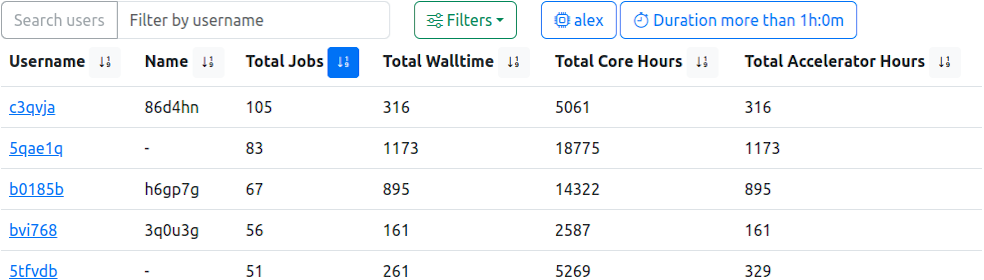
User Table, sorted by ‘Total Jobs’ in descending order. In addition, active filters reduce the underlying data to jobs with more than one hour runtime, started on the GPU accelerated cluster.
This view lists all users which are, and were, active on the configured clusters. Information about the total number of jobs, walltimes and calculation usages are shown.
It is possible to filter the list by username using the equally named prompt, which also accepts partial queries.
The filter component allows limitation of the returned users based on job parameters like start timestamp or memory usage.
The table can be sorted by clicking the respective icon next to the column headers.
Please Note: By default, a “Last 30 Days” filter is activated by default when opening this view.
Managers Only: For users with
manager authority, this view will be titled ‘Managed Users’ in the navigation bar. Managers will only be able to see other user accounts of the managed projects.Details
| Column | Description | Note |
|---|---|---|
| User Name | The user account jobs are associated with | Links to the users’ job list with preset filter returning only jobs of this user and additional histograms |
| Name | The name of user | |
| Total Jobs | Users’ total of all started jobs | |
| Short Jobs | Users’ total of all jobs below short duration threshold (as defined by the configuration) | |
| Total Cores | Conditional, if running jobs: Users’ total of all cores allocated to currently running jobs | |
| Total Accelerators | Conditional, if running jobs: Users’ total of all accelerators allocated to currently running jobs | |
| Total Walltime | Users’ total requested walltime | |
| Total Core Hours | Users’ total of all used core hours | |
| Total Accelerator Hours | Users’ total of all used accelerator hours | Please Note: This column is always shown, and will return 0 for clusters without installed accelerators |
7 - Projects
Table of All Projects Running Jobs on the Clusters
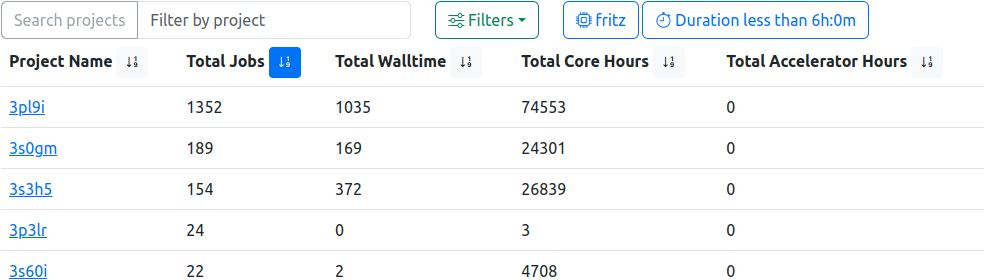
Project Table, sorted by ‘Total Jobs’ in descending order. In addition, active filters reduce the underlying data to jobs with less than six hours runtime, started on the CPU exclusive cluster.
This view lists all projects (usergroups) which are, and were, active on the configured clusters. Information about the total number of jobs, walltimes and calculation usages are shown.
It is possible to filter the list by project name using the equally named prompt, which also accepts partial queries.
The filter component allows limitation of the returned projects based on job parameters like start timestamp or memory usage.
The table can be sorted by clicking the respective icon next to the column headers.
Please Note: By default, a “Last 30 Days” filter is activated by default when opening this view.
Managers Only: For users with
manager authority, this view will be titled ‘Managed Projects’ in the navigation bar. Managers will only be able to see colected data of managed projects.Details
| Column | Description | Note |
|---|---|---|
| Project Name | The project (usergoup) jobs are associated with | Links to a job list with preset filter returning only jobs of this project |
| Total Jobs | Project total of all started Jobs | |
| Short Jobs | Project total of all jobs below short duration threshold (as defined by the configuration) | |
| Total Cores | Conditional, if running jobs: Project total of all cores allocated to currently running jobs | |
| Total Accelerators | Conditional, if running jobs: Project total of all accelerators allocated to currently running jobs | |
| Total Walltime | Project total requested walltime | |
| Total Core Hours | Project total of all used core hours used | |
| Total Accelerator Hours | Project total of all used accelerator hours | Please Note: This column is always shown, and will return 0 for clusters without installed accelerators |
8 - Tags
Lists Active Tags Used in the Frontend
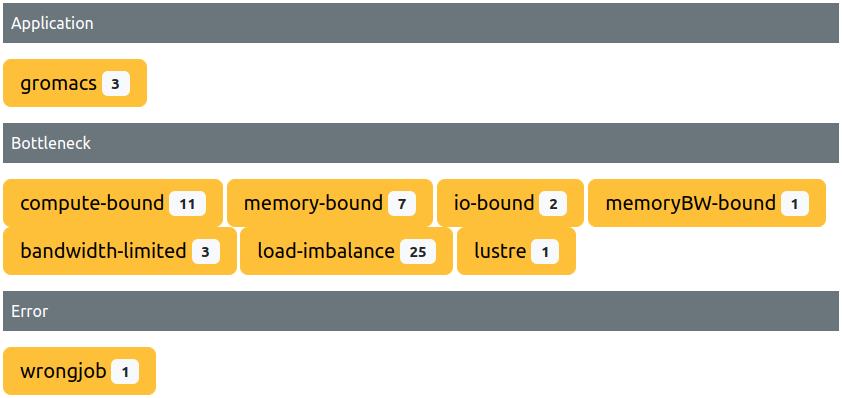
This view lists all tags currently used within the ClusterCockpit instance:
- The
Tag Typeof the tag(s) is displayed as dark grey header, collecting all tags which share it, with a total count shown on the right. - The
Names of all tags sharing oneTag Type, the number of matching jobs per name, and the scope are rendered as pills below the header, colored accordingly (see below).
Each tags’ pill is clickable, and leads to a job list with a preset filter matching only jobs tagged with this specific label.
Tag Scopes
Tags are categorized into three “Scopes” of visibility, and colored accordingly:
- Admin (Cyan): Only administrators can create and attach these tags. Only visible for administrators and support personnel.
- Global (Purple): Administrators and support personnel can create and attach these tags. Visible for everyone.
- Private (Yellow): Everyone can create and attach private tags, only visible to the creator.
Remove Tags
Tags and all job attachements can be removed from the database if a red X symbol is attached to the tags’ pill. A confirmation popup will appear after which the tag and all attachements are deleted, and the tag is removed from th list.
The following rules apply:
- Only Administrators are authorized to remove tags with scopes “global” and “admin” via this functionality in this view.
- Managers and Support-Personnel can not remove “global” and “admin” tags from the database this way.
- Every User, including staff, can remove their own “private” tags (but not those of other users).
Please note: Creating tags and adding/removing them to/from jobs is either done by using the respective REST API calls, or manually from the job view.
9 - Nodes
Node Based Metric Information of one Cluster
Node Overview
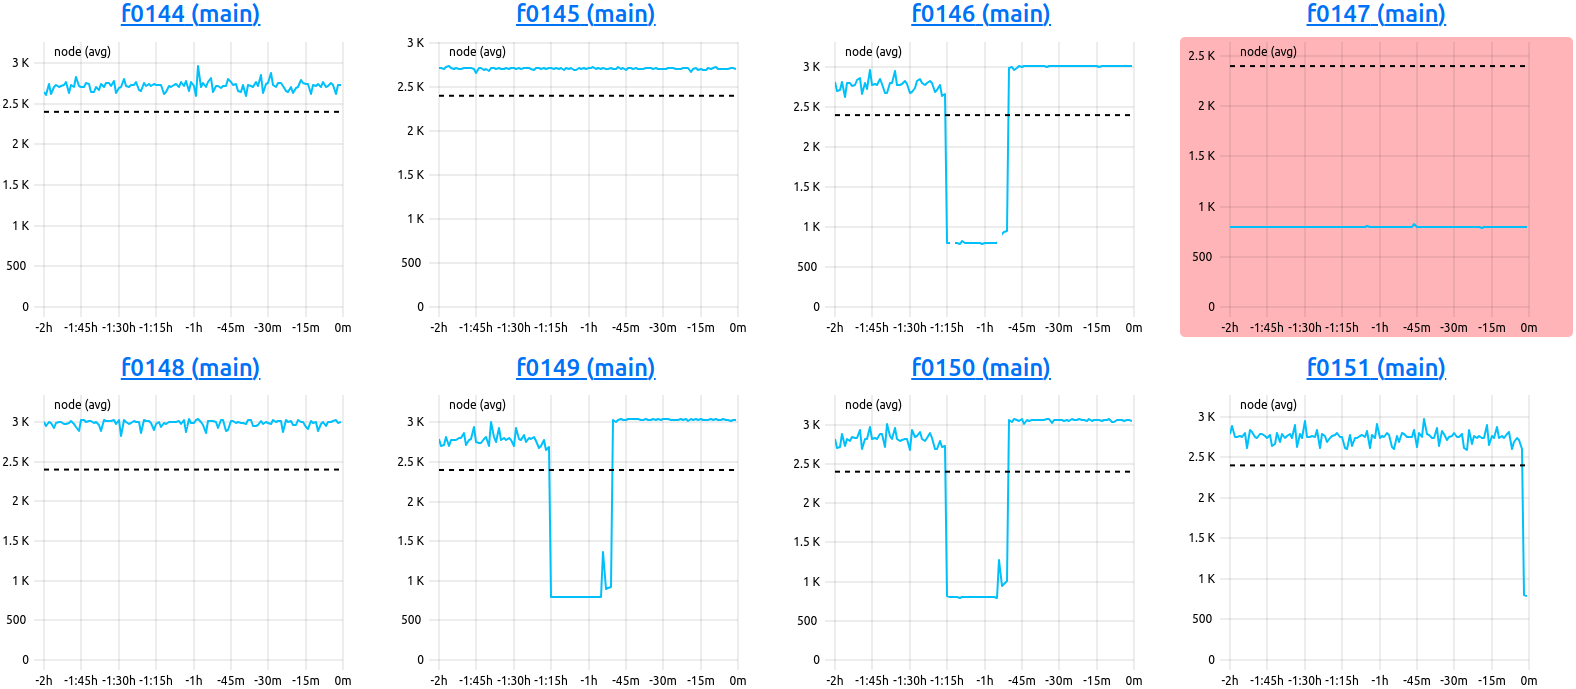
Nodes View. This example shows the last two hours of the ‘clock’ metric of eight nodes. Node ‘f0147’ of the ‘main’ partition has an average below the configured ‘alert’ threshold, and is colored in red.
The node overview is always called in respect to one specified cluster. It displays the current state of all nodes in that cluster in respect to one selected metric, rendered in form of metric plots, and independent of job meta data, i.e. without consideration for job start and end timestamps.
Please note: The X-Axis of all plots rendered in this view are relative to the latest data point received from the collector daemon, and thus, the time displayed reaches backward as indicated by negative X-axis labels.
Overview Selection Bar

Selections regarding the display, and update, of the plots rendered in the node table can be performed here:
- Find Node:: Filter the node table by hostname. Partial queries are possible.
- State:: Filter the node table by last reported node state.
- Displayed Timerange: Select the timeframe to be rendered in the node table
Custom: Select timestampfromandtoin which the data should be fetched. It is possible to select date and time.15 Minutes, 30 Minutes, 1 Hour, 2 Hours, 4 Hours, 12 Hours, 24 Hours
- Metric:: Select the metric to be fetched for all nodes. If no data can be fetched, messages are displayed per node.
- (Periodic) Reload: Force reload of fresh data from the backend or set a periodic reload in specified intervals
30 Seconds, 60 Seconds, 120 Seconds, 5 Minutes
Node Table
Nodes (hosts) are ordered alphanumerically in this table, rendering the selected metric in the selected timeframe.
Each heading links to the singular node view of the respective host.
A colored pill indicates the currently reported node state for that node.
Node List
Nodes View.
The node list view is also always called in respect to one specified cluster, and optionally, subCluster. It displays the current state of all nodes in that cluster (or subCluster) in respect to a selectable number, and order, of metrics. Plots are rendered in form of metric plots, and are independent of job meta data, i.e. without consideration for job start and end timestamps.
Please note: The X-Axis of all plots rendered in this view are relative to the latest data point received from the collector daemon, and thus, the time displayed reaches backward as indicated by negative X-axis labels.
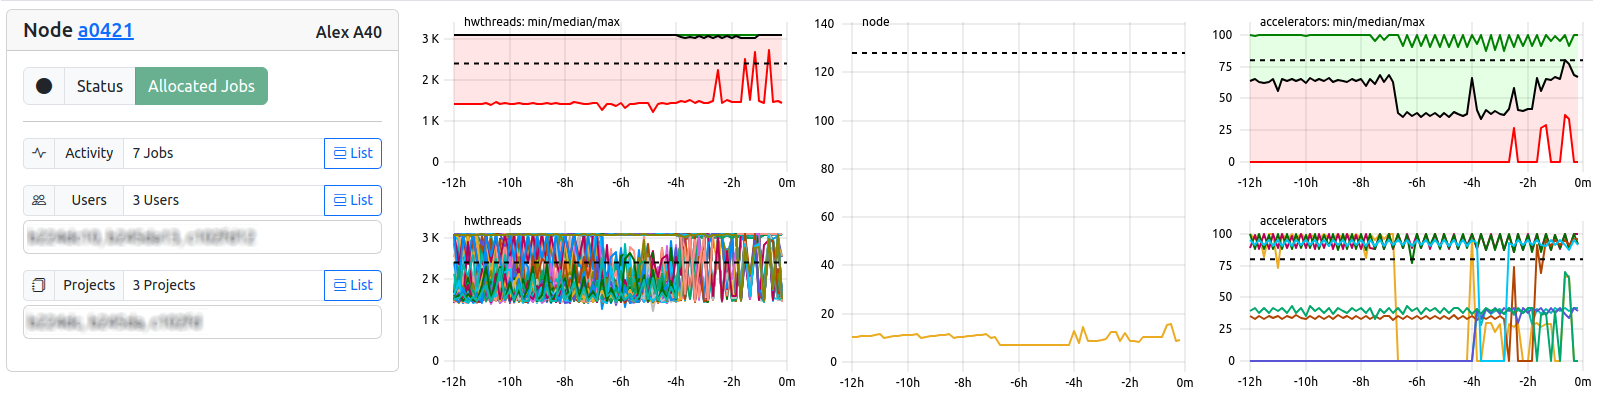
The always visible “Node Info”-Card displays the following information. “List”-Bottons will lead to according views with preset filters.
| Field | Example | Description | Destination |
|---|---|---|---|
| Card Header | Node a0421 Alex A40 | Hostname and Cluster | Node View |
| Job Indicator | Exclusive | Indicates the joba nd metric states via keywords, see below | - |
| State Indicator | Allocated | Indicates the host state via keywords, see below | - |
| Activity | 2 Jobs | Number of Jobs currently running on host | Job List |
| Users | 2 Users | Number and IDs of users currently running jobs | User Table |
| Projects | 1 Project | Number and IDs of projects currently running jobs | Project Table |
In order to give an idea of the current job states, the following indicators are possible for the job indicator:
| Job Indicator | Type | Description |
|---|---|---|
| Fetching | Info | Data for selected metrics is currently fetched from the backend metric store. |
| Missing Metrics | Warning | At least one of the selected metrics does not return data successfully. Can hint to configuration problems. |
| No Metrics | Error | None of the selected metrics return data successfully. Node could be offline or misconfigured. |
| Exclusive | Job-Info | One exclusive job is currently running, utilizing all of the nodes’ hardware. |
| Shared | Job-Info | One or more shared jobs are currently running, utilizing allocated amounts of the nodes’ hardware. |
| Running | Job-Info | If more jobs than one are running, but all jobs are marked as ’exclusive’, this fallback is used. |
| None | Job-Info | No currently active jobs. |
Please note: Job indicator “Warning States” are estimated on the basis of returned metric data from the metric data repository.
The node hardware states are shown as reported by the scheduler and adapter interface. The following indicators are possible for the node state indicator:
| Node Indicator | Color | Description |
|---|---|---|
| Allocated | The node has been allocated to one or more jobs. | |
| Reserved | The node is in an advanced reservation and not generally available. | |
| Idle | The node is not allocated to any jobs and is available for use. | |
| Mixed | The node has some of its CPUs allocated while others are idle. | |
| Down | The node is unavailable for use. Nodes report this state if some failure occurs. | |
| Unknown | The scheduler has just started and the node’s state has not yet been determined. | |
| Not in DB | The node not known in database, but returned metric data. |
List Selection Bar

Nodes List Header Options.
The selection header allows for configuration of the displayed data in terms of selected metrics or timerange.
| Field | Example | Description | |
|---|---|---|---|
| Metrics | 4 Selected | Menu for and Number of Metrics currently selected. | |
| Resolution | 600 | Resolution of the metric plots rendered for each node. | |
| Find Node(s) | a0421 | Filter for hostnames | |
| State | idle | Filter the node table by last reported node state. | |
| Range | Last 12hrs | Time range to be displayed as X-Axis. | |
| Refresh | 60 Seconds | Enable automatic refresh of metric plots. |
Extended Legend
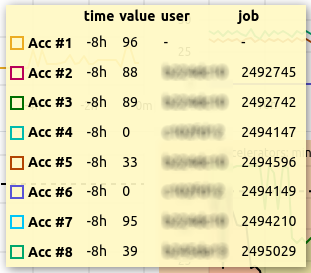
Nodes List Extended Legend. Usernames and Job-IDs are shown in addition to the Resource-ID for shared resources.
For nodes with multiple jobs running on them, accelerator metrics are extended by the username and the job-id currently utilizing this hardware ID. This is based on the ID information sent during job-start to cc-backend (Database resources-column).
10 - Node
All Metrics of One Selected Node
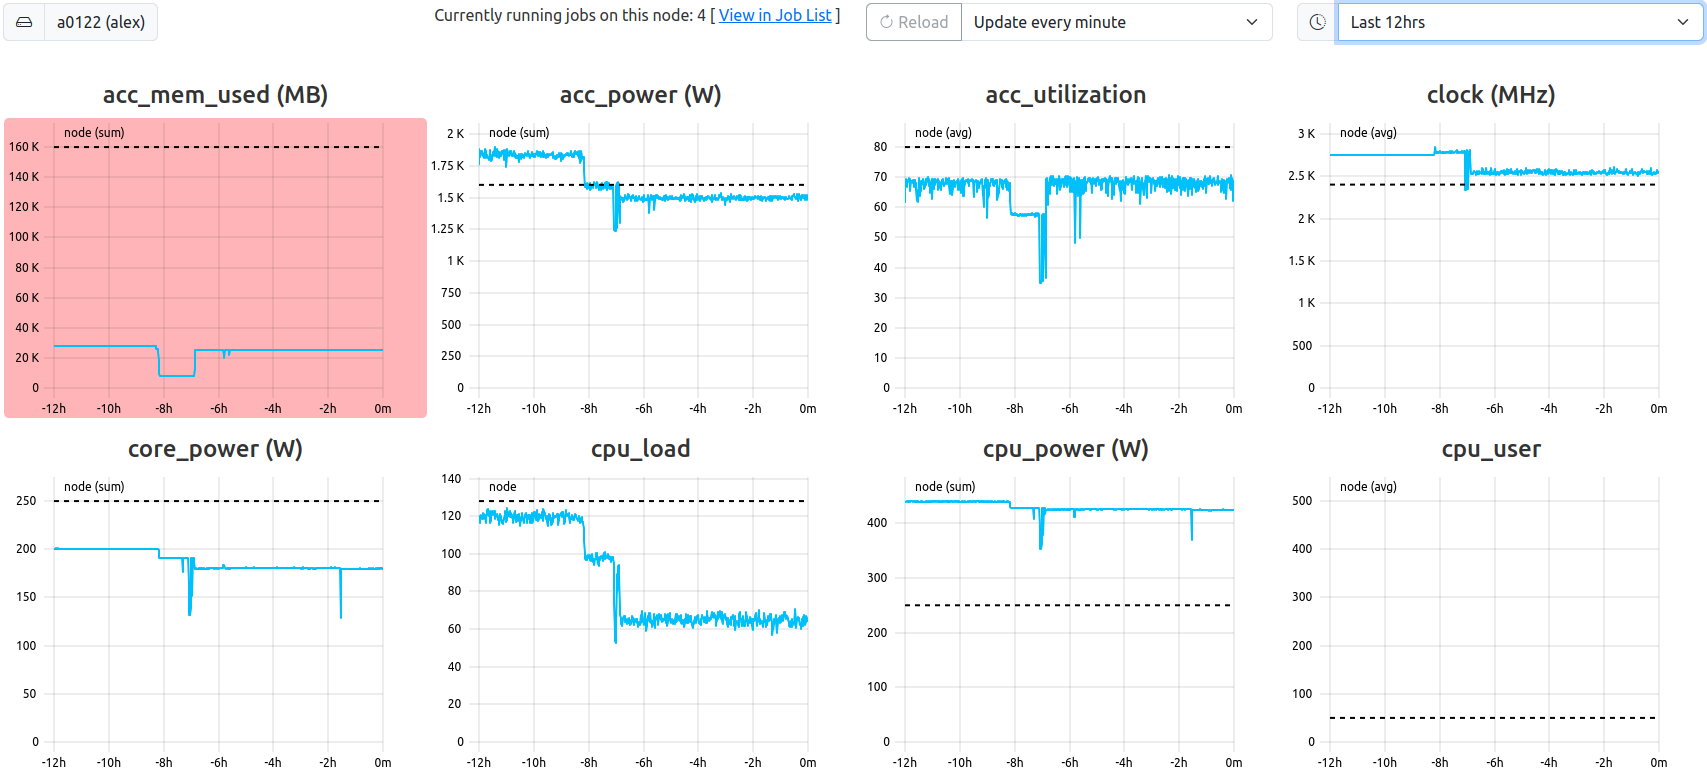
Node View. This example shows the last twelve hours of all metrics of the specified node ‘a0122’. The metric ‘acc_mem_used’ has an average below the configured ‘alert’ threshold, and is colored in red.
The node view is always called in respect to one specified cluster and one specified node (host). It displays the current state of all metrics for that node, rendered in form of metric plots, and independent of job meta data, i.e. without consideration for job start and end timestamps.
Please note: The X-Axis of all plots rendered in this view are relative to the latest data point received from the collector daemon, and thus, the time displayed reaches backward as indicated by negative X-axis labels.
Selection Bar
Information and selections regarding the data of the plots rendered in the node table can be performed here:
- Name: The hostname of the selected node
- Node State: Currently reported node state
- Activity: Number of jobs currently allocated to this node. Exclusively used nodes will always display
1if a job is running at the moment, or0if not.- The “Show List”-Bitton leads to the joblist with preset filter fetching only currently allocated jobs on this node.
- Displayed Timerange: Select the timeframe to be rendered in the node table
Custom: Select timestampfromandtoin which the data should be fetched. It is possible to select date and time.15 Minutes, 30 Minutes, 1 Hour, 2 Hours, 4 Hours, 12 Hours, 24 Hours
- (Periodic) Reload: Force reload of fresh data from the backend or set a periodic reload in specified intervals
30 Seconds, 60 Seconds, 120 Seconds, 5 Minutes
The node hardware states are shown as reported by the scheduler and adapter interface. The following indicators are possible for the node state indicator:
| Node Indicator | Color | Description |
|---|---|---|
| Allocated | The node has been allocated to one or more jobs. | |
| Reserved | The node is in an advanced reservation and not generally available. | |
| Idle | The node is not allocated to any jobs and is available for use. | |
| Mixed | The node has some of its CPUs allocated while others are idle. | |
| Down | The node is unavailable for use. Nodes report this state if some failure occurs. | |
| Unknown | The scheduler has just started and the node’s state has not yet been determined. | |
| Not in DB | The node not known in database, but returned metric data. |
Node Table
Metrics are ordered alphanumerically in this table, rendering each metric in the selected timeframe.
11 - Analysis
Metric Data Analysis View
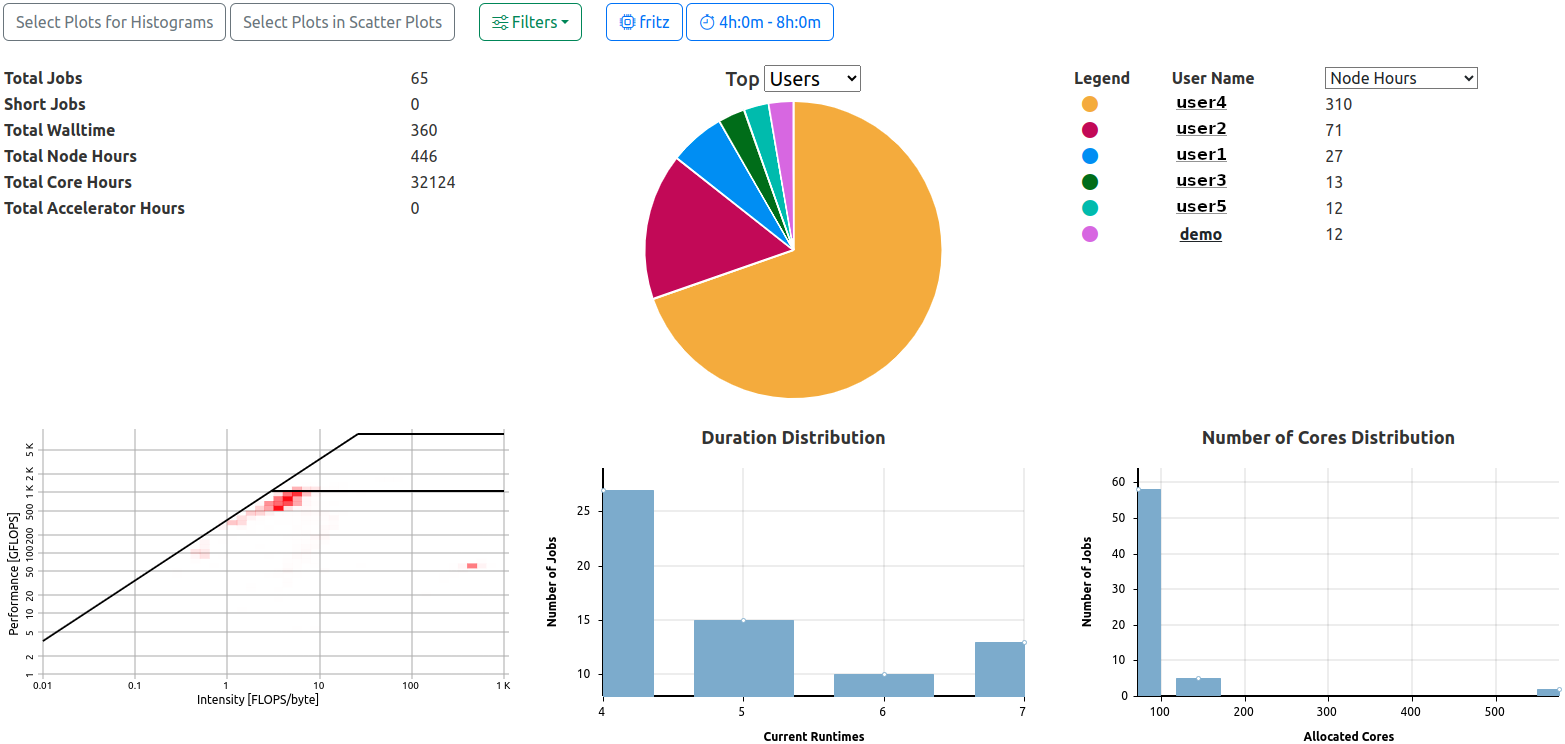
Analysis View General Information Section. Two filters are active, the pie chart displays top user node hour utilization fractions.
The analysis view is always called in respect to one specified cluster. It collects and renders data based on the jobs returned by the active filters, which can be specified to a high detail, allowing analysis of specific aspects.
Please note: By default, the requested data is limited by a preset start time filter to jobs started within the last 6 hours. In addition, some results are not calculated when the returned amount of jobs exceeds 500 entries, in order to save on rendering time.
General Information
The general information section of the analysis view is always rendered and consists of the following elements
Totals
Total counts of collected data based on the returned jobs matching the requested filters:
- Total Jobs
- Total Short Jobs (as defined by the configuration, default: less than 5 minute runtime)
- Total Walltime
- Total Node Hours
- Total Core Hours
- Total Accelerator Hours
Top Users and Projects
The ten most active users or projects are rendered in a combination of pie chart and tabular legend with values displayed. By default, the top ten users with the most jobs matching the selected filters will be shown.
Hovering over one of the pie chart fractions will display a legend featuring the identifier and value of the selected parameter.
The selection can be changed directly in the headers of the pie chart and the table, and can be changed to
| Element | Options |
|---|---|
| Pie Chart | Users, Projects |
| Table | Walltime, Node Hours, Core Hours, Accelerator Hours |
The selection is saved for each user and cluster, and will select the last chosen types of list as default the next time this view is opened.
“User Names” and “Project Codes” are rendered as links, leading to user job lists or project job lists with preset filters for cluster and entity ID.
Please note: The legend colors are fixed by their position, and not by their respective identifier. This means that the orange fraction will always be the largest fraction, even if the contributing user or project changes.
Heatmap Roofline
A roofline plot representing the utilization of available resources as the relation between computation and memory for all jobs matching the filters. In order to represent the data in a meaningful way, the time information of the raw data is abstracted and represented as a heat map, with increasingly red sections of the roofline plot being the most populated regions of utilization.
Histograms
Two histograms depicting the duration and number of allocated cores distributions for the returned jobs matching the filters.
Selectable Data Representations

The second half of the analysis view consists of areas reserved for rendering user-selected data representations.
- Select Plots for Histograms: Opens a selector listing all configured metrics of the respective cluster. One or more metrics can be selected, and the data returned will be rendered as average distributions normalized by node hours (core hours, accelerator hours; depending on the metric).
- Select Plots in Scatter Plots: Opens a selector which allows selection of user chosen combinations of configured metrics for the respective cluster. Selected duplets will be rendered as scatter bubble plots for each selected pair of metrics.
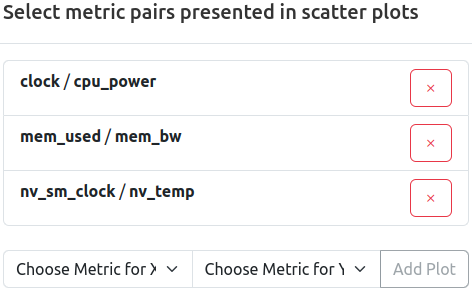
Three pairs of metrics are already selected for scatter representation. Remove a selected pair by pressing the ‘x’ button, add a new pair by selecting two metric from the dropdown menu, and confirming by pressing ‘Add Plot’.
Average Distribution Histograms
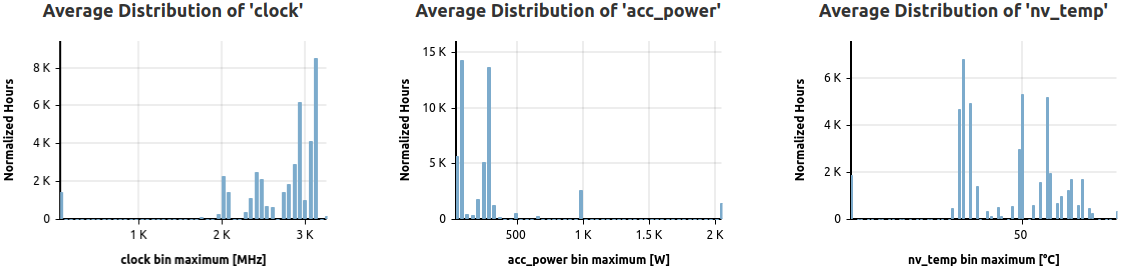
Three selected metrics are represented as normalized, average distributions based on returned jobs.
These histograms show the distribution of the normalized averages of all jobs matching the filters, split into 50 bins for high detail.
Normalization is achieved by weighting the selected metric data job averages by node hours (default), or by either accelerator hours (for native accelerator scope metrics) or core hours (for native core scope metrics).
Please note: Metrics, which are disabled for specific subclusters as per metric configuration file, will be returned as null values if data is requested for the whole cluster, which can affect the rendered distributions. Select a specific partition using the cluster filter to evade this artifact.
User Defined Scatterplots
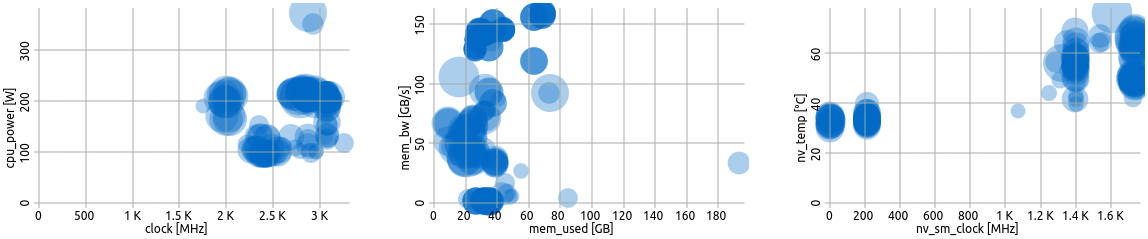
Three user defined scatter plots.
Bubble scatter plots show the position of the averages of two selected metrics in relation to each other.
Each circle represents one job, while the size of a circle is proportional to its node hours. Darker circles mean multiple jobs have the same averages for the respective metric selection.
12 - Status
Hardware Usage Information
The status view is always called in respect to one specified cluster. It displays the current state of utilization of the respective clusters resources, as well as user and project top lists and distribution histograms of the allocated resources per job.
Please note: By default, the periodic reload function is set to
2 Minutes.Utilization Information
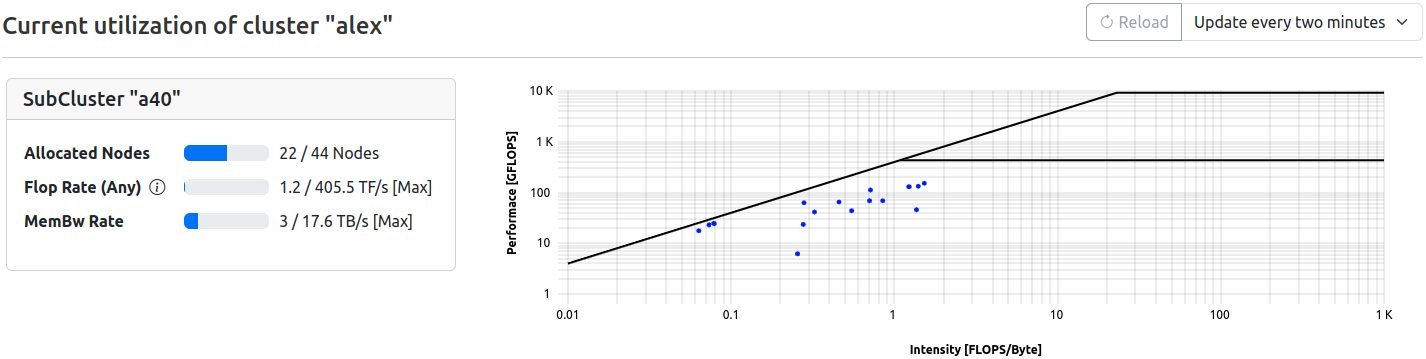
For each subluster, utilization is displayed in two parts rendered in one row.
Gauges
Simple gauge representation of the current utilization of available resources
| Field | Description | Note |
|---|---|---|
| Allocated Nodes | Number of nodes currently allocated in respect to maximum available | - |
| Flop Rate (Any) | Currently achieved flop rate in respect to theoretical maximum | Floprate calculated as f_any = (f_double x 2) + f_single |
| MemBW Rate | Currently achieved memory bandwidth in respect to technical maximum | - |
Roofline
A roofline plot representing the utilization of available resources as the relation between computation and memory for each currently allocated, running job at the time of the latest data retrieval. Therefore, no time information is represented (all dots in blue, representing one job each).
Top Users and Projects
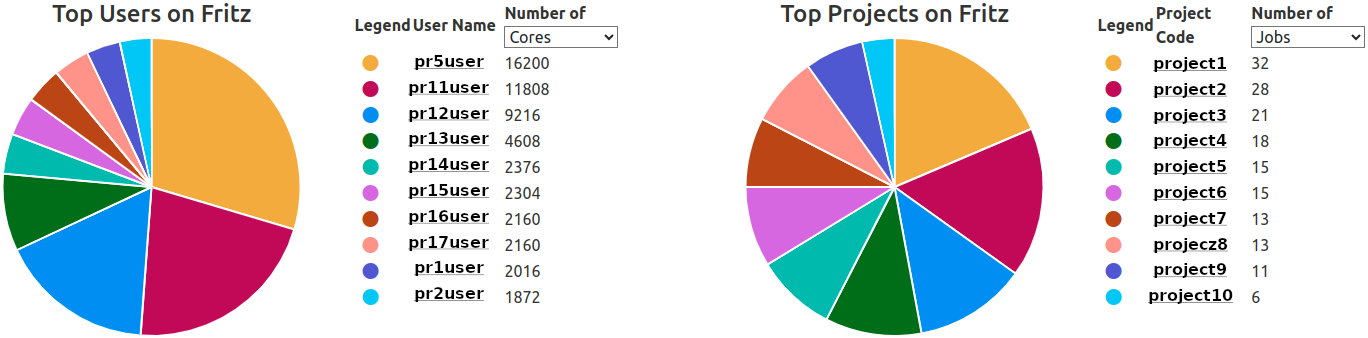
The ten most active users or projects are rendered in a combination of pie chart and tabular legend. By default, the top ten users or projects with the most allocated, running jobs are listed.
The selection can be changed directly in the tables header at Number of ..., and can be changed to
- Jobs (Default)
- Nodes
- Cores
- Accelerators
The selection is saved for each user and cluster, and will select the last chosen type of list as default the next time this view is rendered.
Hovering over one of the pie chart fractions will display a legend featuring the identifier and value of the selected parameter.
“User Names” and “Project Codes” are rendered as links, leading to user job lists or project job lists with preset filters for cluster, entity ID, and state == running.
Please note: The legend colors are fixed by their position, and not by their respective identifier. This means that the orange fraction will always be the largest fraction, even if the contributing user or project changes.
Statistic Histograms
Several histograms depicting the utilization of the clusters resources, based on all currently running jobs are rendered here:
- Duration Distribution
- Number of Nodes Distribution
- Number of Cores Distribution
- Number of Accelerators Distribution
Additional Histograms showing specified footprint metrics across all systems can be selected via the “Select histograms” menu next to the refresher tool.
Please note: Metric statistics available here for selection are configured. All metrics, for which the
footprint flag is set in the respective metrics’ configuration will be shown.Metric Status Tab
The status details panel contains a second tab labeled Metric Status that provides an overview of node health conditions across the cluster.
Node State Distribution
Two pie charts display the current distribution of:
- Scheduler States: The allocation state of nodes as reported by the scheduler (e.g.,
allocated,idle,down). - Health States: The metric monitoring health state of nodes (e.g.,
ok,warn,critical,unknown).
Each chart is paired with a summary table listing each state and the number of nodes in that state.
Node Health Table
A filterable table lists individual nodes with the following columns:
- Hostname: Node identifier, linked to the node detail view.
- Scheduler State: The current scheduler allocation state.
- Health State: The current metric monitoring health state.
- Faulty Metrics: List of metrics that are missing or reporting unhealthy values.
The table can be filtered by hostname, scheduler state, or health state using the filter inputs above each column.