Filters
Categories:
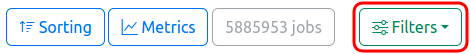
Filter Button as displayed in Job List Views
The ClusterCockpit filter component is used for reducing the number of jobs, either for direct display in job list views, or to specifiy the data-source for collecting information displayed in user or project tables, as well as the analysis view.
Filter Options

Three active filters have reduced the total job count considerably
Multiple filters can be easily combined by selecting more than one option of the available filters.
By clicking on the respective filter pill, colored in blue, and located right of the filter component, one can directly access the respective filters’ menu for editing, or removing, the filter.
At the moment, the following filters are implemented:
Cluster/Partition
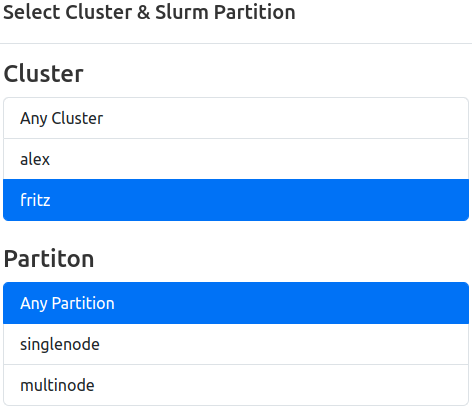
Select a configured cluster, or a specified partition of a given cluster, and display only jobs started on that cluster (and partition).
Options: All cluster names, and nested partition names, configured in config.json
Default: Any Cluster (Any Partition)
Job States

Select one or more job states, and display only jobs matching the selected criteria. Additionally, filters for resource sharing as well as processing type can be selected. Combinations are possible, for example: Only Running, Shared, Batch Processed Jobs.
A note on sharing option nomenclature: Select options are chosen to be “Human Readable”, while the strings used in the backend database column job.shared differ as follows:
| Option Name | Database String |
|---|---|
| All | No Filter Applied |
| Exclusive | none |
| Shared | multi_user |
| Multitask | single_user |
- State Options:
Pending, Running, Completed, Failed, Timeout, Deadline, Preempted, Suspended, Cancelled, Out_of_memory, Boot_fail, Node_fail - Sharing Options:
All, Exclusive, Shared, Multitask - Processing Options:
All, Interactive, Batch Processed
Default: All states, all sharing types, all processing types
meta_data.jobName == 'interactive'! If interactive jobs are permitted on your site, but use a different naminig scheme or a different method to differentiate them from batch processed jobs, please contact or support mail adress.Start Time
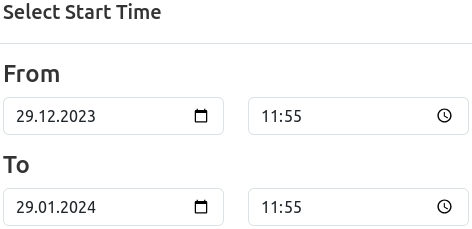
Select the timeframe in which jobs were started, and display only jobs matching the selected criteria.
Options: Free selection of date dd.mm.YYYY and time hh:mm for from and to limits.
Default: All Starttimes
Preset: Jobs started one month ago until $now
Duration
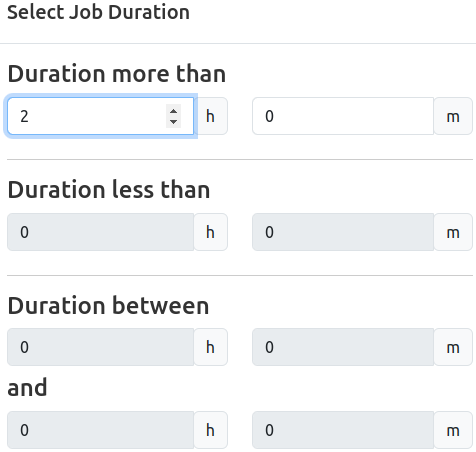
Select the duration of jobs, and display only jobs matching the selected criteria.
Options: Duration less than hh:mm, duration more than hh:mm, duration between two duration selections. Only one of the three options can be used at a time.
Default: All Durations
Tags

Select one or more job tags, and display only jobs tagged with the selected tags.
Options: All available tags. It is possible to search within the list of tags.
Default: No selection
Resources
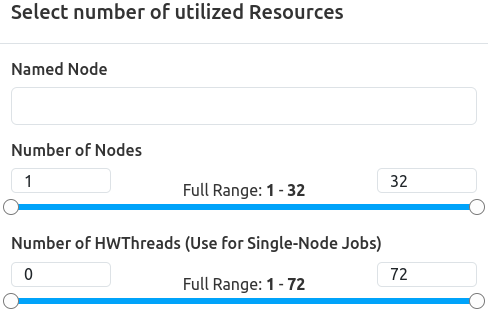
Select a named node or specify an amount of used resources, and display only jobs matching the selected criteria.
Options:
- Named node free text field: Enter a hostname here to only return jobs which were ran on this node. Select the desired match logic (Defaults to “Equal”, i.e. exact match).
- Range selectors: Select a range of allocated job resources ranging from the minimal to the maximum configured resource count of all clusters. If the cluster filter is set, the ranges are limited to the respective resources’ configuration. Available resources are:
- Nodes
- HWThreads
- Accelerators (if available)
Default: No named node, full resource ranges of all configured clusters
Energy
Specify total consumed energy, and display only jobs matching the selected range.
Options: “Total Job Energy” in kWh.
Default: No selection
running.Statistics
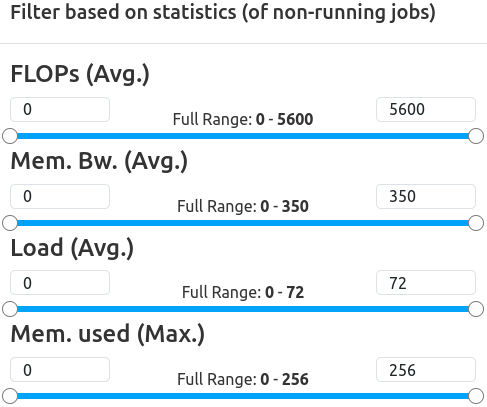
Specify ranges of metric statistics, and display only jobs matching the selected criteria.
footprint flag is set in the respective metrics’ configuration will be available here.Example Options:
- FLOPs (Avg.): Select Range
From-Toby dragging the slider or entering values directly. - Memory Bandwith (Avg.): Select Range
From-Toby dragging the slider or entering values directly. - Load (Avg.): Select Range
From-Toby dragging the slider or entering values directly. - Memory Used (Max.): Select Range
From-Toby dragging the slider or entering values directly.
Default: Full metric statistics ranges as configured
Short Jobs Quick Selections
Quickly select whether to only show or exclude short jobs with a duration of less than a configured runtime. Will display as a normal duration filter.
If no other setting for short-running-jobs-duration is used, the default cutoff is 5 minutes.
Options: Only Short Jobs, Exclude Short Jobs
Default: No selection
Start Time Quick Selections
Quickly select a preconfigured range of job start times. Will display as named start time filter.
When the returned URL is copied and shared, the named filter value will transfer over.
Options: Last 6 hours, Last 24 hours, Last 7 Days, Last 30 Days
Default: No selection
Feedback
Was this page helpful?
Glad to hear it! Please tell us how we can improve.
Sorry to hear that. Please tell us how we can improve.