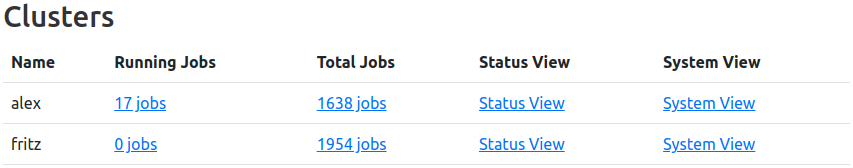
ClusterCockpit home table for two configured clusters
The entrypoint for each login via the login mask is a table containing each configured cluster as a row with the following columns:
Name: The configured clusters’ name
Running Jobs: Number of Jobs currently running longer than 5 minutes (or configured shortRunning amount of time)
Clicking the Link will forward to the job list with preset filters for cluster and running jobs
Total Jobs: Number of Jobs in the respective job-archive
Clicking the Link will forward to the job list with preset filter for cluster
Status View: Link to the status dashboard of the respective cluster
This column is only shown for users with admin authority.
Systems View: Link to the node overview of the respective cluster
This column is only shown for users with admin authority.
Navigation Bar
The navigation bar allows direct access to ClusterCockpits’ different views and functions. Depending on the users’ authorization, the selectable views can differ.
For most viewports, the navigation bar is rendered fully expanded:
On smaller viewports, the navigation bar will be rendered in one of two collapsed states:
Partially collapsed navigation bar. ‘Groups’ will expand to show links for Users, Projects, Tags, and Nodes views. ‘Stats’ will expand to show links for Analysis and Status views. Searchbar, Logout and Settings not shown here, but are still rendered explicitly in this case.
On mobile devices, the navigation bar as a whole is reduced into a burger navigation icon, and will display all views, as well as the searchbar, as stacked navigation menu.
1 - Settings
Webinterface Settings Page
The settings view allows non-privileged users to choose their preferred paging style, to customize how metric plots are rendered, and to generate personalized tokes for use with the API. Customization options include line width, number of plots per row (where applicable), whether backgrounds should be colored, and the color scheme of multi-line metric plots.
If required, users can also enable a color blind friendly mode here. Different variants of color schemes for timeseries plots will be displayed and can be chosen as before. Other adaptions for better clarity include: Timeseries plot colored backgrounds, statistics data rendering, pie and stacked chart color schemes.
Administrators will also find an administrative interface for handling local user accounts. This includes creating local accounts from the interface, editing user roles, listing and deleting existing users, generating JSON Web Tokens for API usage, and delegating managed projects for manager role users.
Apart from user management options, administrators have acces to multiple tools such as presentation mode, resampling information (if configured), homepage notice editing, and access to the public cluster status dashboards (BETA).
New users can be created directly via the web interface. On successful creation a green response message will be returned, and the user is directly visible in the “Special Users” table - If the user has at least two roles, or a single role other than user.
Error messages will also be displayed if the user creation process failed. No user account is saved to the database in this case.
Please note: Users are usually imported via LDAP on ClusterCockpit startup.
Field
Option
Note
Username (ID)
string
Required, must be unique
Password
string
Only API users are allowed to have a blank password, users with a blank password can only authenticate via JW tokens
Allows to inspect jobs and users of all projects, has no admin view or settings access
Admin
General access
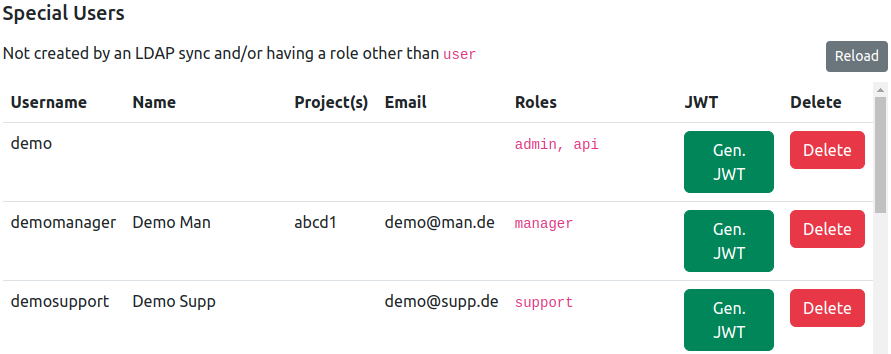
Special Users
This table does not contain users who only have user as their only role saved in the database. This is the case for all users created by LDAP import, and thus, these users will not be shown here. However, LDAP users’ roles can still be edited, and will appear in the table as soon as a authority higher than user or two authorities were granted.
All other special case users, e.g. new users manually created with support role, will appear in the list.
User accounts can be deleted by pressing the respective function displayed for each user entry - A verification pop-up window will appear to stop accidental user deletion.
Additionally, JWT tokens for specific users can be generated here as well.
Column
Example
Description
Username
abcd1
Username of this user
Name
Paul Atreides
Name of this user
Project(s)
abcd
Managed project(s) of this user
Email
demo@demo.com
Email adress of this user
Roles
admin,api
Role(s) of this user
JWT
Press button to reveal freshly generated token
Generate a JWT for this user for use with the CC REST API endpoints
Delete
Press button to verify deletion
Delete this user
Edit User Role
On creation, users can only have one role. However, it is allowed to assign multiple roles to an user account. The addition or removal of roles is performed here.
Enter an existing username and select an existing (for removal) or new (for addition) role in the drop-down menu.
Then press the respective button to remove or add the selected authority from the user account. Errors will be displayed if existing roles are added or non-existing roles are removed.
Edit Managed Projects
On creation, users can only have one managed project. However, it is allowed to assign multiple projects to a manager account. The addition or removal of projects is performed here.
Enter an existing username and select an existing (for removal) or new (for addition) project by entering the respective projectId.
Then press the respective button to remove or add the selected project from the manager account. Errors will be displayed if existing projects are added, non-existing projects are removed, or if the user account is not authorized to manage projects at all.
Scramble Names (Presentation Mode)
Activating this switch will replace all user names, person names, and project names with random strings. Intended for presentations on a production system while retaining critical information from a publc audience.
Public Dashboard Links (BETA)
Collected here are links per cluster leading to the “Public” version of cluster status dashboards. These are intended to be displayed on publicly displayed screens to inform users of the current cluster health in publicly accessible areas.
BETA Warning:Currently, administrator authority is required to use these views! An active administrator session needs to be and will be kept open while displaying the view on public displays. At the moment, this view is intended for testing the layout, selection and performance of the collected information. As such, we tag this functionality in BETA status as of now.
Metric Plot Resampling
If “Resampling” of metric plots is enabled in the configuration file (config.json), and read correctly on start-up, this informational display will list both the amount of data points on whichthe next resolution will be requested (“Trigger”) as well as the applicable resolutions themselves.
Note: Changes to the resampling options have to be perfofmed by changing the configuration file and restarting the application.
Edit Notice Shown On Homepage
The contents of the text form field will be written into $CCPATH/var/notice.txt on submission. If this file does not exist, it will be created.
If any content is found, an informational card will be rendered above the home site table. The content will also be mirrored within the form field itself.
Removing any content from the form field, and submitting, will clear the file and remove the rendered card from the homepage. This state is indicated by the placeholder text “No Content.” being shown in the form field.
2 - Searchbar
Toplevel Searchbar Functionality
ClusterCockpit Searchbar
The top searchbar will handle page wide searches either by entering a searchterm directly as <query>, or by using a “keyword” implemented in the form of <keyword>:<query>. Entering a searchterm directly will start a hierarchical search which will return the first match in the hierarchy (see table below). It is recommended to supply the search with a keyword to specify the searched entity. For example, jobName:myJobName will specifically search for all jobs which have the queried string (or a part thereof) in their metadata jobName field. For all keywords with examples, see the table below.
Both keywords and queries are trimmed of all spaces before performing the search, returning the same results independently of location and number of spaces, e.g. name : Paul and name: paul are both handled identically.
Unprocessable queries will return a message detailing the cause of the error.
Available Keywords
Please note: Hovering over the information icon right of the query field will list all keywords in the webinterface.
Works with partial queries. Allows multiple identical matches, e.g. JobNames from different clusters. An additional Last 30 Days filter is active by default.
Works with partial queries. Only active users are returned. Users without jobs are not shown. An additional Last 30 Days filter is active by default. Admin Only
All Jobs of the given arrayJobId. An additional Last 30 Days filter is active by default.
3 - Plots
Plot Descriptions and Functionality
Most plots visible in the ClusterCockpit webinterface are implemented via uPlot or Chart.js, which both offer various functionality to the user.
Metric Plots
The main plot component of ClusterCockpit renders the metric values retrieved from the systems in a time dependent manner.
Interactivity
A selector crosshair is shown when hovering over the rendered data, data points corresponding to the legend are highlighted.
It is possible to zoom in by dragging a selection square with your mouse. Double-Clicking into the plot will reset the zoom.
Please note: Metric plots will be rendered with regard to the configured normal metric threshold at first, i.e. the threshold will either be the highest rendered value (spaced line), or will be used to cut-off outliers (10 x normal threshold). Resetting by double-clicking will re-render the plot with regard to the highest value of the dataset, i.e. adapt the Y-axis to match said maximum value.
Resampling of Data
If “Resampling” of metric plots is enabled in the configuration file (config.json), data is primarily loaded on the coarsest resolution. Zooming into the dataset, as described above, will continuously trigger a reload of the data in finer resolutions, until the highest resolution is reached. A finer resolution is requested from the backend as soon as the number of visible data points falls below a configured amount (“Trigger”).
Please note: While archived data is read from disk, and therefore can be resampled in the backend directly, resampling of data for running jobs requires the use of a matching version of CC-Metric-Store.
Running Job metric data read from older versions of CCMS will still return correctly, but will always return in the metrics configured timestep.
Conditional Legends
Hovering over the rendered data will display a legend as hovering box colored in yellow. Depending on the amount of data shown, this legend will render differently:
Single Dataset: Runtime and Dataset Identifier Only
2 to 6 Datasets: Runtime, Line Color and Dataset Identifier
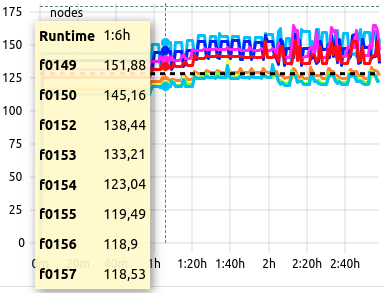
7 to 12 Datasets: Runtime and Dataset Identifier Only
More than 12 Datasets: No Legend
Statistics Datasets: Runtime and Dataset Identifier Only (See below)
The “no legend” case is required to not clutter the display in case of high data volume, e.g. core granularity data for more than 128 cores, which would result in 128 legend entries, possibly blocking the plotting area of metric graphs below.
Example
Eight datasets result in an average value within expected parameters, the background remains white. The legend displays each allocated hostname as dataset identifier.
Colored Backgrounds
The plots’ background is colored depending the average value of the viewed metric in respect to its configured threshold values. The three cases are
White: Metric average within expected parameters. No performance impact.
Yellow: Metric average below expected parameters, but not yet critical. Possible performace impact.
Red: Metric average unexpectedly low. Indicator for suboptimal usage of resources. Performance impact to be expected.
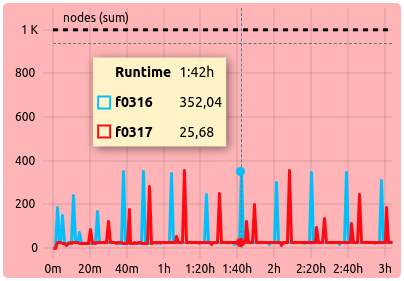
Example
Two datasets result in an average value of less than the configured ‘alert’ threshold: The legend displays both identifiers with their respective color, while the background is colored in red to indicate suboptimal metric performance.
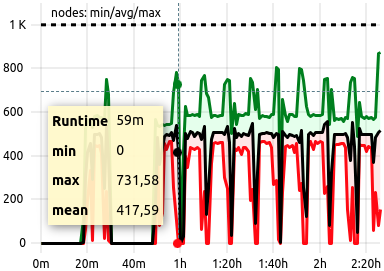
Statistics Variant
In the job list views, high amounts of data are by default rendered as a statistical representation of the numerous, single datasets:
Maximum: The maximum values of the base datasets of each point in time, over time. Colored in green.
Median: The median values of the base datasets of each point in time, over time. Colored in black.
Minimum: The minimal values of the base datasets of each point in time, over time. Colored in red.
Example
A job with a high count of allocated nodes, running well within expected metric parameters. Since, by definition, the colors for this statistical render are always identical, only the runtime and the statistic datasets’ identifiers are shown.
Note: Archived jobs might still show “Max/Average/Min” in their metric plots. This is due to these jobs being archived before the change in favor of median values was perfomed.
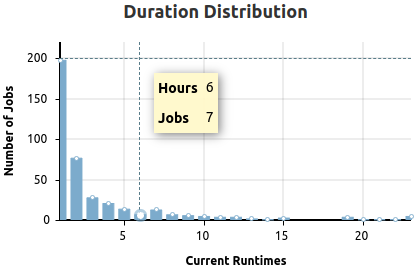
Histograms
Histograms display (binned) data allowing distributions of the repective data source to be visualized. Data highlighting, zooming, and resetting the zoom work as described for metric plots.
Example
Duration distribution of selected jobs. The legends will display the X-Axis value label first, then the Y-Axis value label. The legend is shown for each bar individually when hovering the selection crosshair over the inspected bar. A highlight will show as white dot at the top.
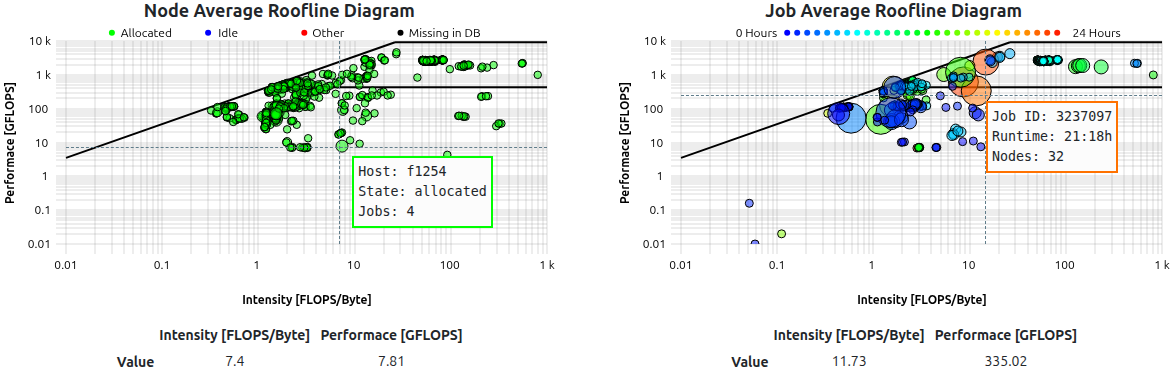
Roofline Plot
A roofline plot, or roofline model, represents the utilization of available resources as the relation between computation and memory usage.
Bubble Roofline
The roofline models shown in the status dashboard views are rendered as bubble scatterplots. Utilization data represents either the job-average or the node-average of the last 5 minutes of sampled data, i.e running jobs or reported node metrics.
Additional information is rendered by color and size of the bubbles, depending on the data source:
Type
Color
Size
Node Roofline
The current scheduler state of the node.
The current number of parallel jobs currently running on the node.
Job Roofline
The current job duration.
The amount of resources used by the job (Number of allocated nodes OR number of allocated accelerators).
Clicking on a bubble will open a new tab with either the respective jobs’ detail view, or the respective nodes’ metric overview.
Example
Roofline models as shown for a subcluster. Legend on hover displays additional information as written text.
Scatter Roofline
The roofline model shown in the job detail view is rendered as dotted scatterplot. It renders every sampled utilization data point colored by time.
Example
Roofline model as shown for a single job. Time information is encoded in the color range, starting from blue dots and ending in red dots.
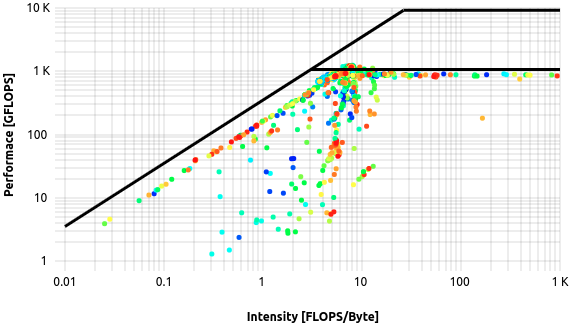
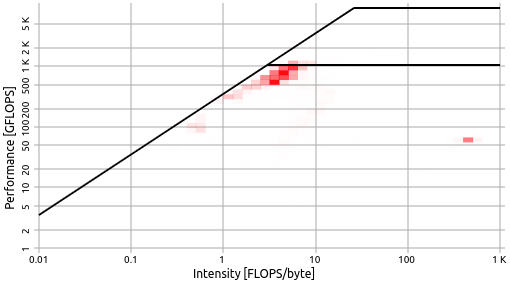
Heatmap Roofline
The roofline model shown in the analysis view is rendered as a heatmap. This is due to the data being displayed is derived from a number of jobs greater than one, since the analysis view returns all jobs matching the selected filters. The roofline therefore colors regions of accumulated activity in increasing shades of red, depicting the regions below the roofs in which the returned jobs primarily perform.
Please note: The plot is rendered in double-logarithmic scaling, yet the lines in the background seem linear: The heatmap roofline is rendered manually (and directly) using only HTML canvas, while the dotted roofline model is rendered with the help of the uPlot package, which allows easy display of double-log scales.
Example
In this example, the selected jobs perform in near optimal, as depicted by increased job activity right below the first ‘knee’ of the roofline model.
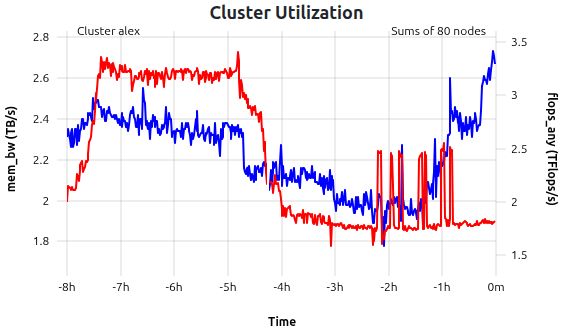
Double Metric Plot
Variant of the default metric plot rendering data on Y1 and Y2 axes over time. Currently only used in status dashboards to display cluster-wide memory bandwidth and flops per second sums, scaled to Tera (1012), as a measure of cluster utilization.
Example
mem_bw (blue) and flops_any (red) metrics as time-dependent sums over all nodes of cluster alex. In this example, the data is shown for the last 8 hours of 80 nodes.
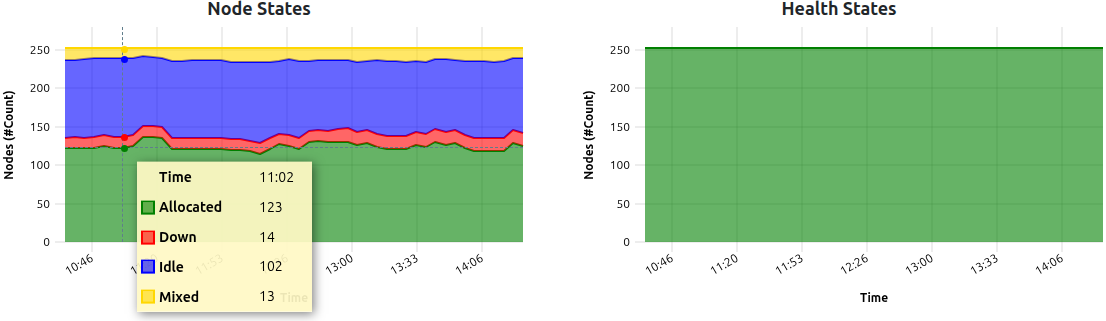
Stacked State Plot
For indicating the development of reported cluster scheduler node states, or metric health states, a stacked representation of the counts over time is used. The sum of all timeseries Y-values is representative of the total sum of reporting nodes.
Color
Green
Yellow
Red
Blue
Magenta
Black
Scheduler States
Allocated
Mixed
Down
Idle
Reserved
Unknown
Health States
Full
Partial
Failed
-
-
-
Example
In this example, a total of 250 nodes reported their respective state information for the last four hours. ‘Node States’ report minor fluctuations of four states currently present within the cluster. ‘Health States’ report optimal quality of the transmitted metrics during an identical timeframe.
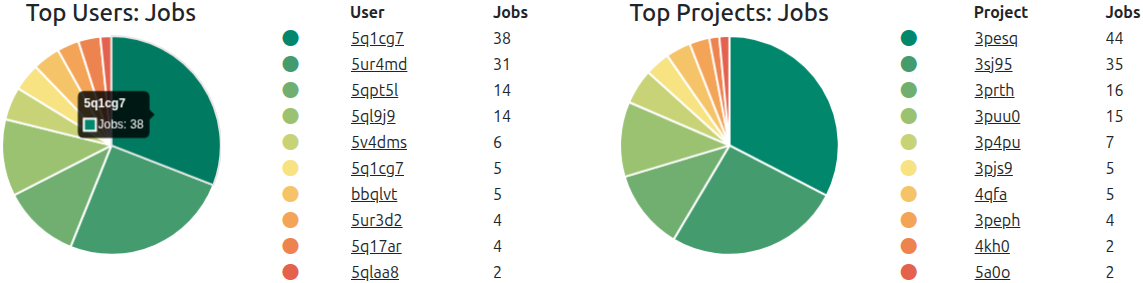
Pie Charts
Current distributions of, for example, top usage information for clusters, or the latest state of node health (see above), will be rendered using classic pie chart representation. Pie charts in ClusterCockpit are always accompanied by a color legend as well as a table representation of the data. Entities such as users or projects are always linked and will lead to the respective view in a new tab.
Example
Pie charts representing top usage by job count for single users and project groups, respectively (Name scrambling is active). Color scheme of pie charts will change if color blind mode is enabled.
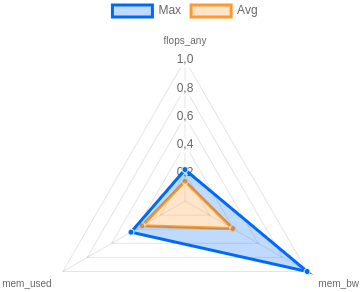
Polar Plots
A polar, or radar, plot represents the utilization of key metrics. Both the maximum and the average utilization as a fraction of the 100% theoretical maximum (labelled as 1.0) are rendered on a number of axes equal to the displayed key metrics. This leads to an increasing area, which in return marks increasingly optimal resource usage. In principle, this is a graphic representation of data also shown in the footprint component.
By clicking on one of the two legends, the respective dataset will be hidden. This can be useful if high overlap reduces visibility.
Example
In this example, the selected job performs quite well, as depicted in the acceptable and equally distributed usage of core metrics. On average, all three metrics are utilized at about 20% (0.2) of the configured hardware maximum. At a point in time, the maximum even reached close to 100% (1.0) of the memory bandwidth (mem_bw).
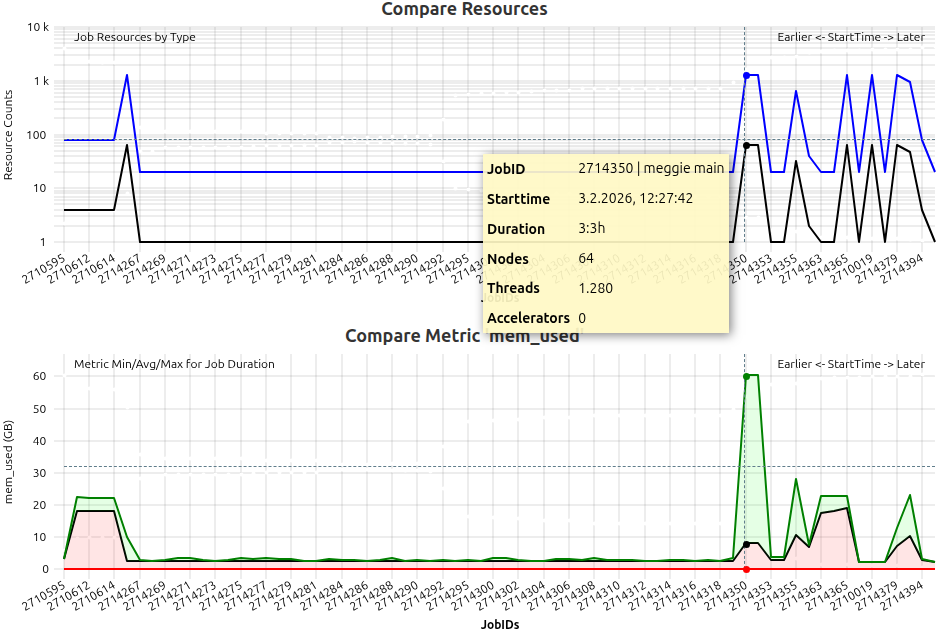
Comparogram
A special plot coined “Comparogram” to display information about multiple jobs, sorted by start_time-timestamp, for comparison purposes.
Used in the “Job Compare”-functionality, the top plot always shows the allocated resources of the compared jobs in a semi-logarithmic manner, with X the JobID and Y the resource count. Three types of resources are rendered, if found: Nodes (Black line, always at least with a value of 1), Threads (Blue line, always at least with a value of 1), and Accelerators (Red line, can be 0).
The resource compare plot is always accompanied by (at least) one metric comparison plot. For the selected metric, the job statistics calculated over the full runtime of the respective job are rendered, and plotted according to job start timestamp.
To make localization of interesting artifacts easier, the pointer is synchronized between all rendered compare plots in the compare view.
Example
Example of compare plot usage. Top plot shows resource usage of jobs running on a CPU-Only cluster, with additional information in the legend per hovered job. The second plot shows the mem_used metric statistics for each compared job with an easily recognizable peak, probably due to the high resource allocation of the respective job.
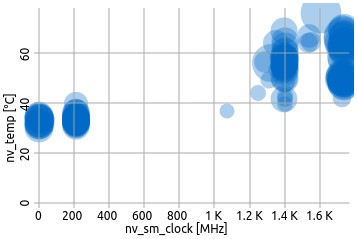
Scatter / Bubble Plot
Bubble scatter plots show the position of the averages of two selected metrics in relation to each other.
Each circle represents one job, while the size of a circle is proportional to its node hours. Darker circles mean multiple jobs have the same averages for the respective metric selection.
Example
In this example, the selected metrics are accelerator clock on the X-axis and accelerator temperature on the Y-axis. Expectedly, long running, high-clock jobs accumulate in the top-right corner, while jobs with less demanding (less clocking) jobs remain cooler.
4 - Filters
Webinterface Filter Options
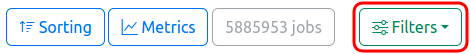
Filter Button as displayed in Job List Views
The ClusterCockpit filter component is used for reducing the number of jobs, either for direct display in job list views, or to specifiy the data-source for collecting information displayed in user or project tables, as well as the analysis view.
Filter Options
Three active filters have reduced the total job count considerably
Multiple filters can be easily combined by selecting more than one option of the available filters.
By clicking on the respective filter pill, colored in blue, and located right of the filter component, one can directly access the respective filters’ menu for editing, or removing, the filter.
At the moment, the following filters are implemented:
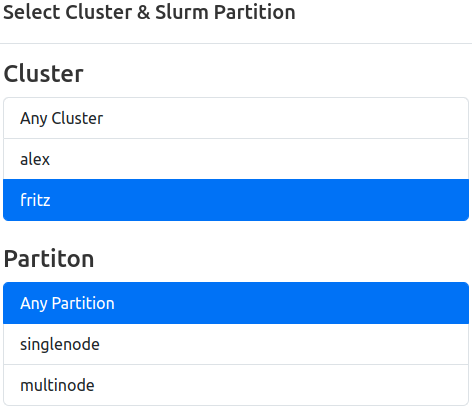
Cluster/Partition
Select a configured cluster, or a specified partition of a given cluster, and display only jobs started on that cluster (and partition).
Options: All cluster names, and nested partition names, configured in config.json
Default: Any Cluster (Any Partition)
Job States
Select one or more job states, and display only jobs matching the selected criteria. Additionally, filters for resource sharing as well as processing type can be selected. Combinations are possible, for example: Only Running, Shared, Batch Processed Jobs.
A note on sharing option nomenclature: Select options are chosen to be “Human Readable”, while the strings used in the backend database column job.shared differ as follows:
Default: All states, all sharing types, all processing types
BETA Warning:Currently, processing type filters depend simply on meta_data.jobName == 'interactive'! If interactive jobs are permitted on your site, but use a different naminig scheme or a different method to differentiate them from batch processed jobs, please contact or support mail adress.
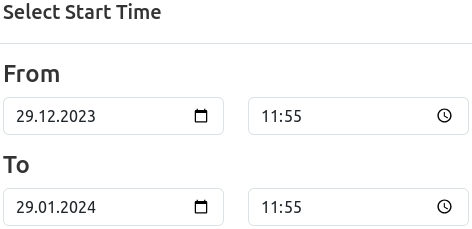
Start Time
Select the timeframe in which jobs were started, and display only jobs matching the selected criteria.
Options: Free selection of date dd.mm.YYYY and time hh:mm for from and to limits.
Default: All Starttimes
Preset: Jobs started one month ago until $now
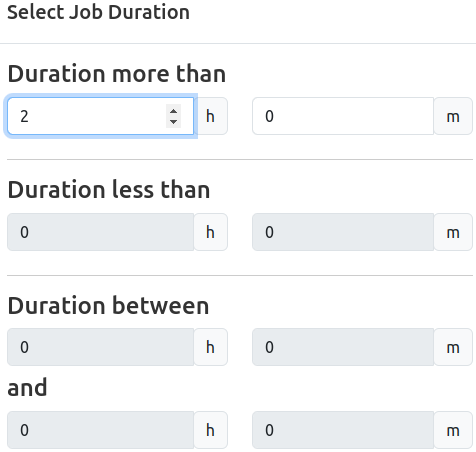
Duration
Select the duration of jobs, and display only jobs matching the selected criteria.
Options: Duration less than hh:mm, duration more than hh:mm, duration between two duration selections. Only one of the three options can be used at a time.
Default: All Durations
Tags
Select one or more job tags, and display only jobs tagged with the selected tags.
Options: All available tags. It is possible to search within the list of tags.
Default: No selection
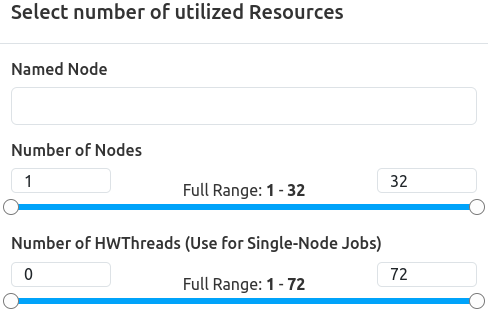
Resources
Select a named node or specify an amount of used resources, and display only jobs matching the selected criteria.
Options:
Named node free text field: Enter a hostname here to only return jobs which were ran on this node. Select the desired match logic (Defaults to “Equal”, i.e. exact match).
Range selectors: Select a range of allocated job resources ranging from the minimal to the maximum configured resource count of all clusters. If the cluster filter is set, the ranges are limited to the respective resources’ configuration. Available resources are:
Nodes
HWThreads
Accelerators (if available)
Default: No named node, full resource ranges of all configured clusters
Energy
Specify total consumed energy, and display only jobs matching the selected range.
Options: “Total Job Energy” in kWh.
Default: No selection
Please note: Consumed energy will be written during archiving after a job has finished. Thus, this filter only works on jobs which are not marked as running.
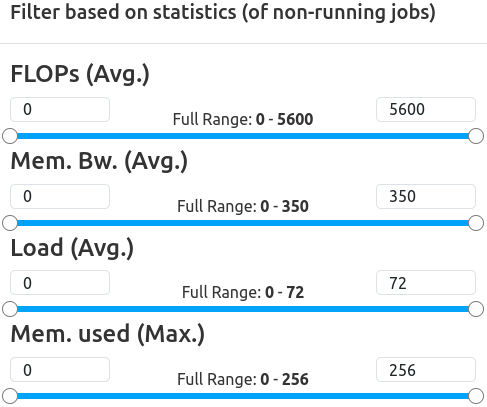
Statistics
Specify ranges of metric statistics, and display only jobs matching the selected criteria.
Please note: Metric statistics listed here for selection are configured. All metrics, for which the footprint flag is set in the respective metrics’ configuration will be available here.
Example Options:
FLOPs (Avg.): Select Range From-To by dragging the slider or entering values directly.
Memory Bandwith (Avg.): Select Range From-To by dragging the slider or entering values directly.
Load (Avg.): Select Range From-To by dragging the slider or entering values directly.
Memory Used (Max.): Select Range From-To by dragging the slider or entering values directly.
Default: Full metric statistics ranges as configured
Short Jobs Quick Selections
Please note: Not available in all views! Additionally, at least one active filter is required.
Quickly select whether to only show or exclude short jobs with a duration of less than a configured runtime. Will display as a normal duration filter.
If no other setting for short-running-jobs-duration is used, the default cutoff is 5 minutes.
Options:Only Short Jobs, Exclude Short Jobs
Default: No selection
Start Time Quick Selections
Quickly select a preconfigured range of job start times. Will display as named start time filter.
When the returned URL is copied and shared, the named filter value will transfer over.
Options:Last 6 hours, Last 24 hours, Last 7 Days, Last 30 Days
Default: No selection
5 - Views
View-Specific Frontend Usage Information.
Usage descriptions for each view of the ClusterCockpit web interface.
5.1 - My Jobs
All Jobs as Table of the Active User
Personal User Job View. Similar to the general job list view, this view expands it by user-specific meta data, as well as distributions histograms.
The “My Jobs” View is available to all users regardless of authority and displays the users personal jobs, i.e. jobs started by this users username on the cluster systems.
The view is a personal variant of the user job view and therefore also consists of three components: Basic Information about the users jobs, selectable statistic histograms of the jobs, and a generalized job list.
Users are able to change the sorting, select and reorder the rendered metrics, filter, and activate a periodic reload of the data.
User Information and Basic Distributions
The top row always displays personal usage information, independent of the selected filters. Information displayed:
Username
Person Name (if available in DB)
Total Jobs
Short Jobs (as defined by the configuration, default: less than 5 minute runtime)
Total Walltime
Total Core Hours
Additional histograms depicting the distribution of job duration and number of nodes occupied by the returned jobs are affected by the selected filters.
The binning of the duration histogram can be selected by the user. The options are as follows:
Bin Size
Number of Bins
Maximum Displayed Duration
1 Minute (1m)
60
1 Hour
10 Minute (10m)
72
12 Hours
1 Hour (1h, Default)
48
2 Days
6 Hours (6h)
12
3 Days
12 Hours (12h)
14
1 Week
Selectable Histograms
Histograms depicting the distribution of the selected jobs’ statistics can be selected from the top navbar “Select Histograms” button. The displayed data is based on the jobs returned from active filters, and will be pulled from the database.
The binning of the statistics histograms can be selected by the user, the bin limits are calculated automatically.
The options are as follows: 10 (Default), 20, 50, 100.
Please note: Metrics statistics listed here for selection are configured. All metrics, for which the footprint flag is set in the respective metrics’ configuration will be available here.
Job List
The job list displays all jobs started by your username on the systems. Additional filters will always respect this limitation. For a detailed description of the job list component, see the related documentation.
Job Compare
The job list also allows comparison of either user selected jobs or of all job listed, if the total number of jobs does not exceed 500 matches. For a detailed description of the job list component, see the related documentation.
5.2 - User Jobs
All Jobs as Table of a Selected User
User Job View. Similar to the general job list view, this view expands it by user-specific meta data, as well as distribution histograms.
The “User Jobs” View is only available to management and supporting staff and displays jobs belonging to a single user other than the active user, i.e. jobs started by other users on the cluster systems can be reviewed in detail by the supporting staff or administrators.
The view consists of three components: Basic Information about the users jobs, selectable statistic histograms of the jobs, and a generalized job list.
Users are able to change the sorting, select and reorder the rendered metrics, filter, and activate a periodic reload of the data.
User Information and Basic Distributions
The top row always displays information about the user, independent of the selected filters.
Information displayed:
Username
Person Name (if available in DB)
Total Jobs
Short Jobs (as defined by the configuration, default: less than 5 minute runtime)
Total Walltime
Total Core Hours
Additional histograms depicting the distribution of job duration and number of nodes occupied by the returned jobs are affected by the selected filters.
The binning of the duration histogram can be selected by the user. The options are as follows:
Bin Size
Number of Bins
Maximum Displayed Duration
1 Minute (1m)
60
1 Hour
10 Minute (10m)
72
12 Hours
1 Hour (1h, Default)
48
2 Days
6 Hours (6h)
12
3 Days
12 Hours (12h)
14
1 Week
Selectable Histograms
Histograms depicting the distribution of the selected jobs’ statistics can be selected from the top navbar “Select Histograms” button. The displayed data is based on the jobs returned from active filters, and will be pulled from the database.
The binning of the statistics histograms can be selected by the user, the bin limits are calculated automatically.
The options are as follows: 10 (Default), 20, 50, 100.
Please note: Metrics statistics listed here for selection are configured. All metrics, for which the footprint flag is set in the respective metrics’ configuration will be available here.
Job List
The job list displays all jobs started by this users username on the systems. Additional filters will always respect this limitation. For a detailed description of the job list component, see the related documentation.
Job Compare
The job list also allows comparison of either user selected jobs or of all job listed, if the total number of jobs does not exceed 500 matches. For a detailed description of the job list component, see the related documentation.
5.3 - Job List
A Configurable Table Displaying Jobs According to Filters
Job List. In this example, the optional footprint is displayed, two filters are active, and the table is refreshed every minute. The first job has a high node count, therefore the plots are rendered in the statistics variant. The ‘mem_bw’ metric likely has artifacts as shown by the grey footprint. The second job has tags and displays less than optimal performance in the ‘flops_any’ metric, coloring the respective plot background in orange.
The primary view of ClusterCockpits webinterface is the tabular listing of jobs, which displays various information about the jobs returned by the selected filters. This information includes the jobs’ full meta data, such as runtime or job state, as well as an optional footprint, allowing quick assessment of the jobs performance.
Most importantly, the list displays a selectable array of metrics as time dependent metric plots, which allows detailed insight into the jobs performance at a glance.
Default Users: For users without additional roles, this view is labelled as ‘Job Search’. Displayed jobs are limited to jobs started by the active user, otherwise the functionality is identical, e.g. filtering or footprint display.
Manager Users: For users with additional manager role, this view is labelled as ‘Managed Jobs’. Displayed jobs are limited to jobs started by users of the managed projects (usergroups), otherwise the functionality is identical, e.g. filtering or footprint display.
Job List Toolbar
Several options allow configuration of the displayed data, which are also persisted for each user individually, either for general usage or by cluster.
Sorting
Basic selection of sorting parameter and direction. By default, jobs are sorted by starting timestamp in descending order (latest jobs first). Other selections to sort by are
Duration
Number of Nodes
Number of Hardware-Threads
Number of Accelerators
Total Energy Consumed
Additional configured Metric Statistics
…
Please note: Additional metrics statistics are configured. All metrics, for which the footprint flag is set in the respective metrics’ configuration will be available as additional sorting options.
Switching of the sort direction is achieved by clicking on the arrow icon next to the desired sorting parameter.
Metrics
Selection of metrics shown in the tabular view for each job. The list is compiled from all available configured metrics of the ClusterCockpit instance, and the tabular view will be updated upon applying the changes.
In addition to the metric names themselves, the availability by cluster is indicated as comma seperated list next to the metric identifier. This information will change to the availablility by partition if the cluster filer is active.
It is furthermore possible to edit the order of the selected metrics. This can be achieved by dragging and dropping the metric selectors to the desired order, where the topmost metric will be displayed next to the “Job Info” column, and additional metrics will be added on the right side.
Lastly, the optional “Footprint” Column can be activated (and deactivated) here. It will always be rendered next to the “Job Info” column, while metrics start right of the “Footprint” column, if activated.
Filters
Selection of filters applied to the queried jobs. By default, no filters are activated if the view was opened via the navigation bar. At multiple location throughout the web-interface, direct links will lead to this view with one or more preset filters active, e.g. selecting a clusters’ “running jobs” from the home page will open this view displaying only running jobs of that cluster.
Possible options are:
Cluster/Partition: Filter by configured cluster (and partitions thereof)
Job State: Filter by defined job state(s)
Start Time: Filter by start timestamp
Duration: Filter by job duration
Tags: Filter by tags assigned to jobs
Resources: Filter by allocated resources or named node
Energy: Filter by consumed total energy (for completed jobs only)
Statistics: Filter by average usage of defined metrics
Each filter and its default value is described in detail here.
Job Count
The total number of jobs returned by the backend for the given set of filters.
Search and Reload
Search for specific jobname, project or username (privileged only) using the searchbox by selecting from the dropdown and entering the query.
Force a complete reload of the table data, or set a timed periodic reload (30, 60, 120, 300 Seconds).
Search for specific project
If the Job-List was opened via a ProjectId-Link or the Projects List, the text search will be fixed to the selected project, and allows for filtering jobnames and users in that project, as indicated by the placeholder text.
If desired, the fixed project can be removed by pressing the button right of the input field, returning the joblist to its default state.
Compare Jobs
This button is used to compare either a selected number of jobs or all jobs currently matching the selected filters by switching to the job comparison view.
Users can select the to be compared jobs in the [job info](#job-info section via the selector checkbox in the upper right corner. Alternatively, every combination of job list filters can be used to generate a comparison set.
Please Note: The button will be disabled if the total amount of to be compared jobs exceeds 500 matches.
Job List Table
The main component of the job list view renders data pulled from the database, the job archive (completed jobs) and the configured metric data source (running jobs).
Job Info
The meta data containing general information about the job is represented in the “Job Info” column, which is always the first column to be rendered. From here, users can navigate to the detailed view of one specific job as well as the user or project specific job lists.
Field
Example
Description
Destination
Job Id
123456
The JobId of the job assigned by the scheduling daemon
Indicator for the allocated resources. Single resources will be displayed by name, i.e. exclusive single-node jobs or shared resources. Multiples of resources will be indicated by icons for nodes, CPU Threads, and accelerators.
-
Partition
main
The cluster partition this job was startet at
-
Start Timestamp
10.1.2024, 10:00:00
The epoch timestamp the job was started at, formatted for human readability
-
Duration
0:21:10
The runtime of the job, will be updated for running jobs on reload. Additionally indicates the state of the job as colored pill
-
Walltime
24:00:00
The allocated walltime for the job as per job submission script
-
Two additional functions are located in the upper right corner of each job information segment for each job, namely, a helper to easily copy the respective job ID to the clipboard as well as the selector checkbox to mark the respective job for job comparison (see above).
Footprint
The optional footprint column will show base metrics for job performance at a glance, and will hint to performance (and performance problems) in regard to configurable metric thresholds.
Please note: Metric statistics displayed here are configured. All metrics, for which the footprint flag is set in the respective metrics’ configuration will be shown in this view.
Examples:
Field
Description
Note
cpu_load
Average CPU utilization
-
flops_any
Floprate calculated as f_any = (f_double x 2) + f_single
-
mem_bw
Average memory bandwidth used
Non-GPU Cluster only
mem_used
Maximum memory used
Non-GPU Cluster only
acc_utilization
Average accelerator utilization
GPU Cluster Only
Colors and icons differentiate between the different warning states based on the configured threshold of the metrics. Reported metric values below the warning threshold simply report bad performance in one or more metrics, and should therefore be inspected by the user for future performance improvement.
Metric values colored in blue, however, usually report performance above the expected levels - Which is exactly why these metrics should be inspected as well. The “maximum” thresholds are often the theoretically achievable performance by the respective hardware component, but rarely are they actually reached. Inspecting jobs reporting back such levels can lead to averaging errors, unrealistic spikes in the metric data or even bugs in the code of ClusterCockpit.
Color
Level
Description
Note
Blue
Info
Metric value below maximum configured peak threshold
Selected metrics are rendered here in the selected order as metric lineplots. Aspects of the rendering can be configured at the settings page.
5.4 - Job Comparison
Compare Job Metric Statistics
Job list with compare switch. In this example, filters return 145 jobs, while no job is selected manually.
Accessible from the general job list as well as the user view job lists, the job compare view allows for the comparison of metric statistics in a pseudo-time-dependent manner.
The “Compare Jobs” button is located in the upper right corner of the job list views. Jobs for comparison are either selected by
… a combination of filters resulting in a dataset of 500 jobs or less.
… manual job selection by checking the box in the job info card.
If too many jobs are returned by the current filter selection, the button will be disabled.
If jobs are directly selected from the current job list, the button will display the current count, as well as an additional “Reset” button, which will empty the list of selected jobs, if pressed.
Manual job selection will also work if the current job list has more than 500 returned jobs, while the subsequent job compare view will ignore all additional filters, and only show selected jobs. Returning to the job list also returns with the last used filters.
This allows manual job selection between pages, but also manual job selection between different filter combinations!
Fixed Compare Elements
Job compare view top elements. The count of 145 jobs remains after switching to this view. The resource plot shows jobs sorted by their startTime, and all jobs have allocated accelerators (red data line).
The compare view features a reduced header:
Sorting is disabled, as jobs are always sorted by startTime in ascending order.
The filter component is removed and only shows the total number of compared jobs.
The refresh component is also removed.
The “Metric Selection” is active and can be used to add additional metric comparison plots to the view, if desired.
“Return to List” closes the compare view and restores the former job list view.
The resource compare plot is always shown at the first position. It features a semi-logarithmic view of allocated job resources in a pseudeo-time-dependent manner, as all jobs are sorted by actual start time. The data is colored as follows:
Black: Nodes - will always be at least 1 (Note: Also for shared jobs!)
Blue: Hardware Threads ( ~ Cores)
Red: Accelerators - Can be zero! If so, no line is rendered.
The legend includes further information, such as:
Job-ID
Cluster (and subCluster) on which the job ran
Runtimeof the job
Selectable Compare Elements
Job compare view metric plot and table. ‘Clock’ metric statistics are plotted for every job sorted by their startTime. All information is also shown as sortable table at the bottom of the compare view.
Below the first plot, the individual metric compare plots are rendered. For each job, the Min/Max/Avg of the respective metric is plotted in a banded manner.
Zooming is possible, and will be synchronized to all other rendered plots, including the resource comparison.
Please Note: Due to spacing reasons, not all jobIDs can be rendered as tick-marks if the total count of compared jobs is high!
Below the plots, all information is again rendered as a single table consisting of the following columns:
JobID
Start Time
Duration
Cluster
Resources (Nodes, Threads , Accs)
For each Metric: Minimum, Maximum, Average
It is possible to filter for specific jobIDs or parts thereof, all other columns are sortable.
Clicking on a JobID will lead to the respective Job View.
5.5 - Job
Detailed Single Job Information View
Job View. This example shows a completed, shared job with lacking ‘flops_any’ performance.
The job view displays all data related to one specific job in full detail, and allows detailed inspection of all metrics at several scopes, as well as manual tagging of the job.
Top Bar
The top bar of each job view replicates the “Job Info” and “Footprint” seen in the job list, and additionally renders general metric information in specialized plots.
For shared jobs, a list of jobs which run (or ran) concurrently is shown as well.
Job Information Tabs
Job Info
Identical to the job list equivalent, this component displays meta data containing general information about the job. From here, users can navigate to the detailed view of one specific job as well as the user or project specific job lists.
Field
Example
Description
Destination
Job Id
123456
The JobId of the job assigned by the scheduling daemon. The icon on the right allows for easy copy to clipboard.
Indicator for the allocated resources. Single resources will be displayed by name, i.e. exclusive single-node jobs or shared resources. Multiples of resources will be indicated by icons for nodes, CPU Threads, and accelerators.
-
Partition
main
The cluster partition this job was startet at
-
Start Timestamp
10.1.2024, 10:00:00
The epoch timestamp the job was started at, formatted for human readability
-
Duration
0:21:10
The runtime of the job, will be updated for running jobs on reload. Additionally indicates the state of the job as colored pill
-
Walltime
24:00:00
The allocated walltime for the job as per job submission script
-
At the bottom, all tags attached to the job are listed. Users can manage attachted tags via the “manage X Tag(s)” button.
Concurrent Jobs
In the case of a shared job, a second tab next to the job info will display all jobs which were run on the same hardware at the same time. “At the same time” is defined as “has a starting or ending time which lies between the starting and ending time of the reference job” for this purpose.
A cautious period of five minutes is applied to both limits, in order to restrict display of jobs which have too little overlap, and would just clutter the resulting list of jobs.
Each overlapping job is listed with its jobId as a link leading to this jobs detailed job view.
Admin Note
Optional Tab that only shows if the supporting staff added a note to the job manually, or by the automatic tagging feature.
Usually contains information about notable job behaviours such as resource under-utilization.
Job Utilization Tabs
Footprint
Identical to the job list equivalent, this component will show base metrics for job performance at a glance, and will hint to job quality and problems in regard to configurable metric thresholds. In contrast to the job list, it is always active and shown in the detailed job view.
Please note: Metric statistics displayed here are configured. All metrics, for which the footprint flag is set in the respective metrics’ configuration will be shown in this view.
Examples:
Field
Description
Note
cpu_load
Average CPU utilization
-
flops_any
Floprate calculated as f_any = (f_double x 2) + f_single
-
mem_bw
Average memory bandwidth used
-
mem_used
Maximum memory used
Non-GPU Cluster only
acc_utilization
Average accelerator utilization
GPU Cluster Only
Colors and icons differentiate between the different warning states based on the configured thresholds of the metrics. Reported metric values below the warning threshold simply report bad performance in one or more metrics, and should therefore be inspected by the user for future performance improvement.
Metric values colored in blue, however, usually report performance above the expected levels - Which is exactly why these metrics should be inspected as well. The “maximum” thresholds are often the theoretically achievable performance by the respective hardware component, but rarely are they actually reached. Inspecting jobs reporting back such levels can lead to averaging errors, unrealistic spikes in the metric data or even bugs in the code of ClusterCockpit.
Color
Level
Description
Note
Blue
Info
Metric value below maximum configured peak threshold
Job performance impacted with high probability - Inspection recommended
Dark Grey
Error
Metric value extremely above maximum configured threshold
Inspection required - Metric spikes in affected metrics can lead to errorneous average values
Specific to the job view: In the job view, the footprint component also allows for 1:1 rendering of HTML code, saved within the jobs’ meta data section of the database. This is intended for administrative messages towards the user who created the job, e.g. for displaying warning, hints, or contact information.
Examples
Footprint of a job with performance well within expected parameters, ‘mem_bw’ even overperforms.
Footprint of an accelerated job with mixed performance parameters.
Footprint of a job with performance averages way above the expected maxima - Look for artifacts!
Polar Representation
Next to the footprints, a second tab will render the polar plot representation of the configured footprint metrics. Minimum, Average and Maximum ranges are rendered.
Roofline Representation
A roofline plot representing the utilization of available resources as the relation between computation and memory usage over time (color scale blue -> red). This plot is always shown separately.
Energy Summary
Energy Summary for a completed Job with Accelerators. Carbon Emission Estimate is activated.
For completed jobs, the energy estimates are shown below the top bar. Energy is shown in kilowatt hours for all contributing metrics. If a constant for g/kWh is configured, an additional estimate is calculated which displays the amount of carbon emissions.
Please note: Energy metrics displayed here are configured. All metrics, for which the energy flag is set in the respective metrics’ configuration will be shown in this view.
In addition, “Total Energy” is calculated as the sum of all configured metrics, regardless of their origin. I.e., if core_powerandcpu_power are configured, both values contribute to the total energy.
Metric Plot Table
The views’ middle section consists of metric plots for each metric selected in the “Select Metrics” menu, which defaults to all configured metrics available to the jobs’ cluster and subCluster.
The data shown per metric defaults to the smallest available granularity of the metric with data of all nodes, but can be changed at will by using the drop down selectors above each plot.
If available, the statistical representation can be selected as well, by scope (e.g. stats series (node)).
Please note: The backend will calculate and return a statistical data series if the underlying metric dataset has at least 15 data series, e.g. a job utilizing 15 or more cores.
Tagging
Manual tagging of jobs is performed by using the “Manage Tags” option.
Tags are categorized into three “Scopes” of visibility:
Admin: Only administrators can create and attach these tags. Only visible for administrators and support personnel.
Global: Administrators and support personnel can create and attach these tags. Visible for everyone.
Private: Everyone can create and attach private tags, only visible to the creator.
Available tags are listed, colored by scope, and can be added to the jobs’ database entry simply by pressing the respective button.
The list can be filtered for specific tags by using the “Search Tags” prompt.
New tags can be created by entering a new type:name combination in the search prompt, which will display a button for creating this new tag. Privileged users](/docs/explanation/roles/#administrator-role “Admin Role”) will additionally be able to select the “Scope” (see above) of the new tag.
Statistics and Meta Data
Statistics Table. ‘cpu_power’ granularity is set to ‘socket’. Tabs above switch the contents to the job script or slurm information, both read from the jobs metadata field.
On the bottom of the job view, additional information about the job is collected. By default, the statistics of selected metrics are shown in tabular form, each in their metrics’ native granularity. Metrics are selected independently for the statistics table.
Statistics Table
The statistics table collects all metric statistical values (min, max, avg) for each allocated node and each granularity.
The metrics to be displayed can be selected using the “Select Metrics” selection pop-up window. In the header, next to the metric name, a second drop down allows the selection of the displayed granularity. If no other scopes than node are available, the drop down menu is disabled.
Core and Accelerator metrics default to their respective native granularities automatically.
For multi-node jobs, fine granularities are not requested from the backend from the start. A “Load Scopes” will allow for the later load of more scopes, which will apply to all selected metrics in the statistics table, and also to metrics selected later.
Job Script
This tab displays the job script with which whis job was started on the systems.
Slurm Info
This tab displays information returned drom the SLURM batch process management software.
Missing Metrics or Resources
If mismatches between the supposed availability of metrics and the returned data are detected, an optional tab will list all details for missing metrics and/or missing hardware nodes, which were not found in the metricdata stores.
5.6 - Users
Table of All Users Running Jobs on the Clusters
User Table, sorted by ‘Total Jobs’ in descending order. In addition, active filters reduce the underlying data to jobs with more than one hour runtime, started on the GPU accelerated cluster.
This view lists all users which are, and were, active on the configured clusters. Information about the total number of jobs, walltimes and calculation usages are shown.
It is possible to filter the list by username using the equally named prompt, which also accepts partial queries.
The filter component allows limitation of the returned users based on job parameters like start timestamp or memory usage.
The table can be sorted by clicking the respective icon next to the column headers.
Please Note: By default, a “Last 30 Days” filter is activated by default when opening this view.
Managers Only: For users with manager authority, this view will be titled ‘Managed Users’ in the navigation bar. Managers will only be able to see other user accounts of the managed projects.
Details
Column
Description
Note
User Name
The user account jobs are associated with
Links to the users’ job list with preset filter returning only jobs of this user and additional histograms
Name
The name of user
Total Jobs
Users’ total of all started jobs
Short Jobs
Users’ total of all jobs below short duration threshold (as defined by the configuration)
Total Cores
Conditional, if running jobs: Users’ total of all cores allocated to currently running jobs
Total Accelerators
Conditional, if running jobs: Users’ total of all accelerators allocated to currently running jobs
Total Walltime
Users’ total requested walltime
Total Core Hours
Users’ total of all used core hours
Total Accelerator Hours
Users’ total of all used accelerator hours
Please Note: This column is always shown, and will return 0 for clusters without installed accelerators
5.7 - Projects
Table of All Projects Running Jobs on the Clusters
Project Table, sorted by ‘Total Jobs’ in descending order. In addition, active filters reduce the underlying data to jobs with less than six hours runtime, started on the CPU exclusive cluster.
This view lists all projects (usergroups) which are, and were, active on the configured clusters. Information about the total number of jobs, walltimes and calculation usages are shown.
It is possible to filter the list by project name using the equally named prompt, which also accepts partial queries.
The filter component allows limitation of the returned projects based on job parameters like start timestamp or memory usage.
The table can be sorted by clicking the respective icon next to the column headers.
Please Note: By default, a “Last 30 Days” filter is activated by default when opening this view.
Managers Only: For users with manager authority, this view will be titled ‘Managed Projects’ in the navigation bar. Managers will only be able to see colected data of managed projects.
Details
Column
Description
Note
Project Name
The project (usergoup) jobs are associated with
Links to a job list with preset filter returning only jobs of this project
Total Jobs
Project total of all started Jobs
Short Jobs
Project total of all jobs below short duration threshold (as defined by the configuration)
Total Cores
Conditional, if running jobs: Project total of all cores allocated to currently running jobs
Total Accelerators
Conditional, if running jobs: Project total of all accelerators allocated to currently running jobs
Total Walltime
Project total requested walltime
Total Core Hours
Project total of all used core hours used
Total Accelerator Hours
Project total of all used accelerator hours
Please Note: This column is always shown, and will return 0 for clusters without installed accelerators
5.8 - Tags
Lists Active Tags Used in the Frontend
This view lists all tags currently used within the ClusterCockpit instance:
The Tag Type of the tag(s) is displayed as dark grey header, collecting all tags which share it, with a total count shown on the right.
The Names of all tags sharing one Tag Type, the number of matching jobs per name, and the scope are rendered as pills below the header, colored accordingly (see below).
Each tags’ pill is clickable, and leads to a job list with a preset filter matching only jobs tagged with this specific label.
Tag Scopes
Tags are categorized into three “Scopes” of visibility, and colored accordingly:
Admin (Cyan): Only administrators can create and attach these tags. Only visible for administrators and support personnel.
Global (Purple): Administrators and support personnel can create and attach these tags. Visible for everyone.
Private (Yellow): Everyone can create and attach private tags, only visible to the creator.
Remove Tags
Tags and all job attachements can be removed from the database if a red X symbol is attached to the tags’ pill. A confirmation popup will appear after which the tag and all attachements are deleted, and the tag is removed from th list.
The following rules apply:
Only Administrators are authorized to remove tags with scopes “global” and “admin” via this functionality in this view.
Managers and Support-Personnel can not remove “global” and “admin” tags from the database this way.
Every User, including staff, can remove their own “private” tags (but not those of other users).
Please note: Creating tags and adding/removing them to/from jobs is either done by using the respective REST API calls, or manually from the job view.
5.9 - Nodes
Node Based Metric Information of one Cluster
Node Overview
Nodes View. This example shows the last two hours of the ‘clock’ metric of eight nodes. Node ‘f0147’ of the ‘main’ partition has an average below the configured ‘alert’ threshold, and is colored in red.
The node overview is always called in respect to one specified cluster. It displays the current state of all nodes in that cluster in respect to one selected metric, rendered in form of metric plots, and independent of job meta data, i.e. without consideration for job start and end timestamps.
Please note: The X-Axis of all plots rendered in this view are relative to the latest data point received from the collector daemon, and thus, the time displayed reaches backward as indicated by negative X-axis labels.
Overview Selection Bar
Selections regarding the display, and update, of the plots rendered in the node table can be performed here:
Find Node:: Filter the node table by hostname. Partial queries are possible.
State:: Filter the node table by last reported node state.
Displayed Timerange: Select the timeframe to be rendered in the node table
Custom: Select timestamp from and to in which the data should be fetched. It is possible to select date and time.
Metric:: Select the metric to be fetched for all nodes. If no data can be fetched, messages are displayed per node.
(Periodic) Reload: Force reload of fresh data from the backend or set a periodic reload in specified intervals
30 Seconds, 60 Seconds, 120 Seconds, 5 Minutes
Node Table
Nodes (hosts) are ordered alphanumerically in this table, rendering the selected metric in the selected timeframe.
Each heading links to the singular node view of the respective host.
A colored pill indicates the currently reported node state for that node.
Node List
Nodes View.
The node list view is also always called in respect to one specified cluster, and optionally, subCluster. It displays the current state of all nodes in that cluster (or subCluster) in respect to a selectable number, and order, of metrics. Plots are rendered in form of metric plots, and are independent of job meta data, i.e. without consideration for job start and end timestamps.
Please note: The X-Axis of all plots rendered in this view are relative to the latest data point received from the collector daemon, and thus, the time displayed reaches backward as indicated by negative X-axis labels.
The always visible “Node Info”-Card displays the following information. “List”-Bottons will lead to according views with preset filters.
In order to give an idea of the current job states, the following indicators are possible for the job indicator:
Job Indicator
Type
Description
Fetching
Info
Data for selected metrics is currently fetched from the backend metric store.
Missing Metrics
Warning
At least one of the selected metrics does not return data successfully. Can hint to configuration problems.
No Metrics
Error
None of the selected metrics return data successfully. Node could be offline or misconfigured.
Exclusive
Job-Info
One exclusive job is currently running, utilizing all of the nodes’ hardware.
Shared
Job-Info
One or more shared jobs are currently running, utilizing allocated amounts of the nodes’ hardware.
Running
Job-Info
If more jobs than one are running, but all jobs are marked as ’exclusive’, this fallback is used.
None
Job-Info
No currently active jobs.
Please note: Job indicator “Warning States” are estimated on the basis of returned metric data from the metric data repository.
The node hardware states are shown as reported by the scheduler and adapter interface. The following indicators are possible for the node state indicator:
Node Indicator
Color
Description
Allocated
The node has been allocated to one or more jobs.
Reserved
The node is in an advanced reservation and not generally available.
Idle
The node is not allocated to any jobs and is available for use.
Mixed
The node has some of its CPUs allocated while others are idle.
Down
The node is unavailable for use. Nodes report this state if some failure occurs.
Unknown
The scheduler has just started and the node’s state has not yet been determined.
Not in DB
The node not known in database, but returned metric data.
List Selection Bar
Nodes List Header Options.
The selection header allows for configuration of the displayed data in terms of selected metrics or timerange.
Field
Example
Description
Metrics
4 Selected
Menu for and Number of Metrics currently selected.
Resolution
600
Resolution of the metric plots rendered for each node.
Find Node(s)
a0421
Filter for hostnames
State
idle
Filter the node table by last reported node state.
Range
Last 12hrs
Time range to be displayed as X-Axis.
Refresh
60 Seconds
Enable automatic refresh of metric plots.
Extended Legend
Nodes List Extended Legend. Usernames and Job-IDs are shown in addition to the Resource-ID for shared resources.
For nodes with multiple jobs running on them, accelerator metrics are extended by the username and the job-id currently utilizing this hardware ID. This is based on the ID information sent during job-start to cc-backend (Database resources-column).
5.10 - Node
All Metrics of One Selected Node
Node View. This example shows the last twelve hours of all metrics of the specified node ‘a0122’. The metric ‘acc_mem_used’ has an average below the configured ‘alert’ threshold, and is colored in red.
The node view is always called in respect to one specified cluster and one specified node (host). It displays the current state of all metrics for that node, rendered in form of metric plots, and independent of job meta data, i.e. without consideration for job start and end timestamps.
Please note: The X-Axis of all plots rendered in this view are relative to the latest data point received from the collector daemon, and thus, the time displayed reaches backward as indicated by negative X-axis labels.
Selection Bar
Information and selections regarding the data of the plots rendered in the node table can be performed here:
Name: The hostname of the selected node
Node State: Currently reported node state
Activity: Number of jobs currently allocated to this node. Exclusively used nodes will always display 1 if a job is running at the moment, or 0 if not.
The “Show List”-Bitton leads to the joblist with preset filter fetching only currently allocated jobs on this node.
Displayed Timerange: Select the timeframe to be rendered in the node table
Custom: Select timestamp from and to in which the data should be fetched. It is possible to select date and time.
(Periodic) Reload: Force reload of fresh data from the backend or set a periodic reload in specified intervals
30 Seconds, 60 Seconds, 120 Seconds, 5 Minutes
The node hardware states are shown as reported by the scheduler and adapter interface. The following indicators are possible for the node state indicator:
Node Indicator
Color
Description
Allocated
The node has been allocated to one or more jobs.
Reserved
The node is in an advanced reservation and not generally available.
Idle
The node is not allocated to any jobs and is available for use.
Mixed
The node has some of its CPUs allocated while others are idle.
Down
The node is unavailable for use. Nodes report this state if some failure occurs.
Unknown
The scheduler has just started and the node’s state has not yet been determined.
Not in DB
The node not known in database, but returned metric data.
Node Table
Metrics are ordered alphanumerically in this table, rendering each metric in the selected timeframe.
5.11 - Analysis
Metric Data Analysis View
Analysis View General Information Section. Two filters are active, the pie chart displays top user node hour utilization fractions.
The analysis view is always called in respect to one specified cluster. It collects and renders data based on the jobs returned by the active filters, which can be specified to a high detail, allowing analysis of specific aspects.
Please note: By default, the requested data is limited by a preset start time filter to jobs started within the last 6 hours. In addition, some results are not calculated when the returned amount of jobs exceeds 500 entries, in order to save on rendering time.
General Information
The general information section of the analysis view is always rendered and consists of the following elements
Totals
Total counts of collected data based on the returned jobs matching the requested filters:
Total Jobs
Total Short Jobs (as defined by the configuration, default: less than 5 minute runtime)
Total Walltime
Total Node Hours
Total Core Hours
Total Accelerator Hours
Top Users and Projects
The ten most active users or projects are rendered in a combination of pie chart and tabular legend with values displayed. By default, the top ten users with the most jobs matching the selected filters will be shown.
Hovering over one of the pie chart fractions will display a legend featuring the identifier and value of the selected parameter.
The selection can be changed directly in the headers of the pie chart and the table, and can be changed to
The selection is saved for each user and cluster, and will select the last chosen types of list as default the next time this view is opened.
“User Names” and “Project Codes” are rendered as links, leading to user job lists or project job lists with preset filters for cluster and entity ID.
Please note: The legend colors are fixed by their position, and not by their respective identifier. This means that the orange fraction will always be the largest fraction, even if the contributing user or project changes.
Heatmap Roofline
A roofline plot representing the utilization of available resources as the relation between computation and memory for all jobs matching the filters. In order to represent the data in a meaningful way, the time information of the raw data is abstracted and represented as a heat map, with increasingly red sections of the roofline plot being the most populated regions of utilization.
Histograms
Two histograms depicting the duration and number of allocated cores distributions for the returned jobs matching the filters.
Selectable Data Representations
The second half of the analysis view consists of areas reserved for rendering user-selected data representations.
Select Plots for Histograms: Opens a selector listing all configured metrics of the respective cluster. One or more metrics can be selected, and the data returned will be rendered as average distributions normalized by node hours (core hours, accelerator hours; depending on the metric).
Select Plots in Scatter Plots: Opens a selector which allows selection of user chosen combinations of configured metrics for the respective cluster. Selected duplets will be rendered as scatter bubble plots for each selected pair of metrics.
Three pairs of metrics are already selected for scatter representation. Remove a selected pair by pressing the ‘x’ button, add a new pair by selecting two metric from the dropdown menu, and confirming by pressing ‘Add Plot’.
Average Distribution Histograms
Three selected metrics are represented as normalized, average distributions based on returned jobs.
These histograms show the distribution of the normalized averages of all jobs matching the filters, split into 50 bins for high detail.
Normalization is achieved by weighting the selected metric data job averages by node hours (default), or by either accelerator hours (for native accelerator scope metrics) or core hours (for native core scope metrics).
Please note: Metrics, which are disabled for specific subclusters as per metric configuration file, will be returned as null values if data is requested for the whole cluster, which can affect the rendered distributions. Select a specific partition using the cluster filter to evade this artifact.
User Defined Scatterplots
Three user defined scatter plots.
Bubble scatter plots show the position of the averages of two selected metrics in relation to each other.
Each circle represents one job, while the size of a circle is proportional to its node hours. Darker circles mean multiple jobs have the same averages for the respective metric selection.
5.12 - Status
Hardware Usage Information
The status view is always called in respect to one specified cluster. It displays the current state of utilization of the respective clusters resources, as well as user and project top lists and distribution histograms of the allocated resources per job.
Please note: By default, the periodic reload function is set to 2 Minutes.
Utilization Information
For each subluster, utilization is displayed in two parts rendered in one row.
Gauges
Simple gauge representation of the current utilization of available resources
Field
Description
Note
Allocated Nodes
Number of nodes currently allocated in respect to maximum available
-
Flop Rate (Any)
Currently achieved flop rate in respect to theoretical maximum
Floprate calculated as f_any = (f_double x 2) + f_single
MemBW Rate
Currently achieved memory bandwidth in respect to technical maximum
-
Roofline
A roofline plot representing the utilization of available resources as the relation between computation and memory for each currently allocated, running job at the time of the latest data retrieval. Therefore, no time information is represented (all dots in blue, representing one job each).
Top Users and Projects
The ten most active users or projects are rendered in a combination of pie chart and tabular legend. By default, the top ten users or projects with the most allocated, running jobs are listed.
The selection can be changed directly in the tables header at Number of ..., and can be changed to
Jobs (Default)
Nodes
Cores
Accelerators
The selection is saved for each user and cluster, and will select the last chosen type of list as default the next time this view is rendered.
Hovering over one of the pie chart fractions will display a legend featuring the identifier and value of the selected parameter.
“User Names” and “Project Codes” are rendered as links, leading to user job lists or project job lists with preset filters for cluster, entity ID, and state == running.
Please note: The legend colors are fixed by their position, and not by their respective identifier. This means that the orange fraction will always be the largest fraction, even if the contributing user or project changes.
Statistic Histograms
Several histograms depicting the utilization of the clusters resources, based on all currently running jobs are rendered here:
Duration Distribution
Number of Nodes Distribution
Number of Cores Distribution
Number of Accelerators Distribution
Additional Histograms showing specified footprint metrics across all systems can be selected via the “Select histograms” menu next to the refresher tool.
Please note: Metric statistics available here for selection are configured. All metrics, for which the footprint flag is set in the respective metrics’ configuration will be shown.
Metric Status Tab
The status details panel contains a second tab labeled Metric Status that provides an overview of node health conditions across the cluster.
Node State Distribution
Two pie charts display the current distribution of:
Scheduler States: The allocation state of nodes as reported by the scheduler (e.g., allocated, idle, down).
Health States: The metric monitoring health state of nodes (e.g., ok, warn, critical, unknown).
Each chart is paired with a summary table listing each state and the number of nodes in that state.
Node Health Table
A filterable table lists individual nodes with the following columns: